
- Start >
- Rivers >
- Discharge >
- Bayern >
- Weiboldshausen >
- Chart of year

Chart of year Weiboldshausen / Felchbach
Discharge from 20.04.2024 to 19.04.2025
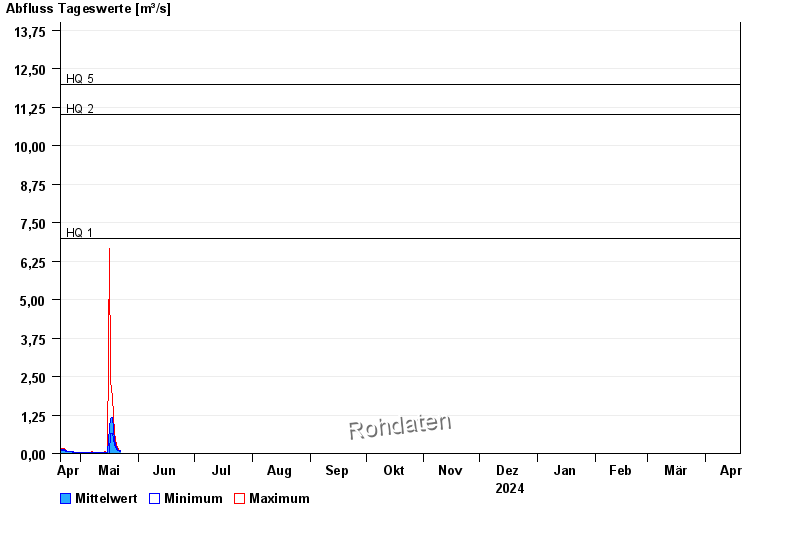
note
Wasserstand und Abfluss wird zeitweise durch Biberdamm beeinflusst.
- HQ1 7 m³/s
- HQ2 11 m³/s
- HQ5 12 m³/s
- HQ10 14 m³/s
- HQ20 17 m³/s
- HQ50 20 m³/s
- HQ100 23 m³/s
| Date | Mean value [m³/s] | Maximum [m³/s] | Minimum [m³/s] |
|---|---|---|---|
| 02.05.2024 | 0.032 | 0.032 | 0.032 |
| 01.05.2024 | 0.032 | 0.039 | 0.032 |
| 30.04.2024 | 0.035 | 0.039 | 0.032 |
| 29.04.2024 | 0.036 | 0.046 | 0.021 |
| 28.04.2024 | 0.046 | 0.046 | 0.046 |
| 27.04.2024 | 0.051 | 0.054 | 0.046 |
| 26.04.2024 | 0.054 | 0.054 | 0.054 |
© Bayerisches Landesamt für Umwelt 2024