

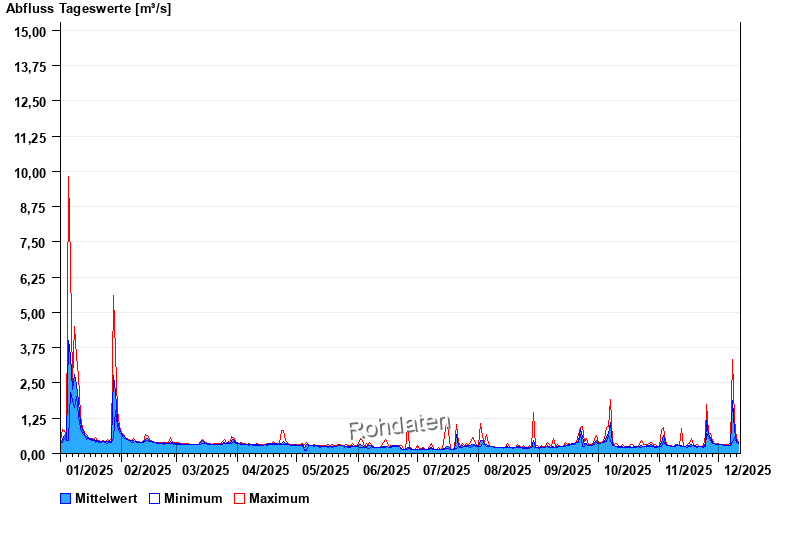
Chart of year Weg / Isen
Discharge from 01.01.2025 to 11.12.2025
- 01.08.1991 Abfluss: 52,8 m³/s
- 04.08.1973 Abfluss: 47,2 m³/s
- 15.02.1990 Abfluss: 45,3 m³/s
- 03.08.1987 Abfluss: 42,6 m³/s
- 02.06.1995 Abfluss: 41,4 m³/s
| Date | Mean value [m³/s] | Maximum [m³/s] | Minimum [m³/s] |
|---|---|---|---|
| 11.12.2025 | 0.387 | 0.39 | 0.369 |
| 10.12.2025 | 0.467 | 0.539 | 0.39 |
| 09.12.2025 | 0.815 | 1.2 | 0.576 |
| 08.12.2025 | 1.87 | 3.33 | 0.39 |
| 07.12.2025 | 0.297 | 0.369 | 0.273 |
| 06.12.2025 | 0.289 | 0.303 | 0.288 |
| 05.12.2025 | 0.29 | 0.303 | 0.288 |
© Bayerisches Landesamt für Umwelt 2025