

Chart of total period Weg / Isen
Discharge from 01.11.1953 to 03.05.2024
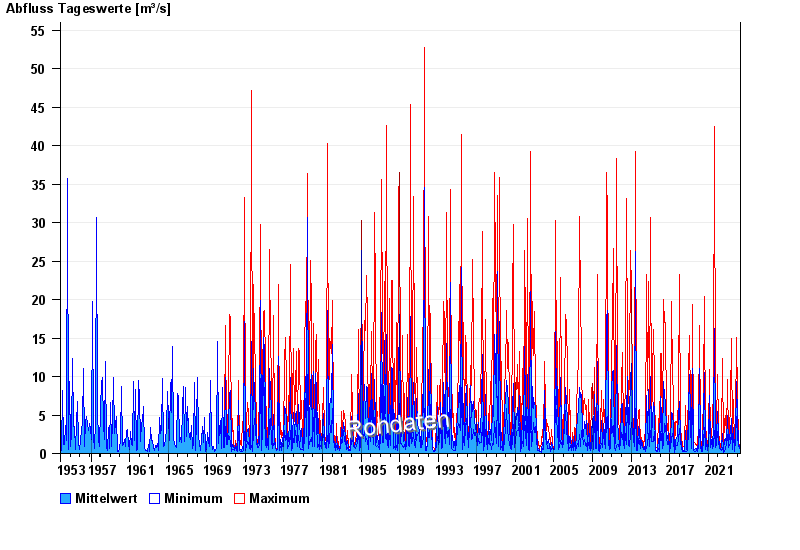
| Date | Mean value [m³/s] | Maximum [m³/s] | Minimum [m³/s] |
|---|---|---|---|
| 03.05.2024 | 0.332 | 0.369 | 0.318 |
| 02.05.2024 | 0.335 | 0.351 | 0.318 |
| 01.05.2024 | 0.345 | 0.351 | 0.318 |
| 30.04.2024 | 0.353 | 0.369 | 0.334 |
| 29.04.2024 | 0.362 | 0.39 | 0.351 |
| 28.04.2024 | 0.379 | 0.39 | 0.369 |
| 27.04.2024 | 0.409 | 0.441 | 0.39 |
© Bayerisches Landesamt für Umwelt 2024