
- Start >
- Rivers >
- Discharge >
- Bayern >
- Unterweißenbrunn >
- Chart of year

Chart of year Unterweißenbrunn / Brend
Discharge from 01.01.2023 to 31.12.2023
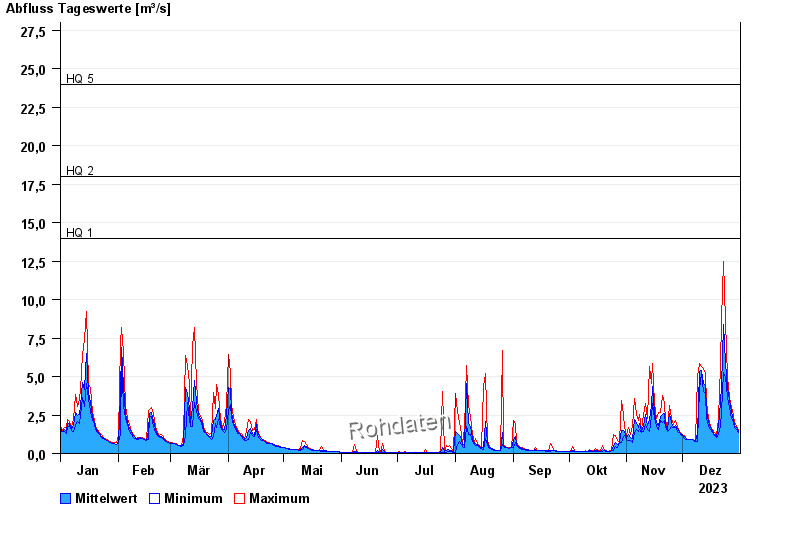
- HQ1 14 m³/s
- HQ2 18 m³/s
- HQ5 24 m³/s
- HQ10 28 m³/s
- HQ20 33 m³/s
- HQ50 39 m³/s
- HQ100 43 m³/s
| Date | Mean value [m³/s] | Maximum [m³/s] | Minimum [m³/s] |
|---|---|---|---|
| 31.12.2023 | 1.45 | 1.54 | 1.34 |
| 30.12.2023 | 1.67 | 1.78 | 1.54 |
| 29.12.2023 | 1.82 | 2.03 | 1.66 |
| 28.12.2023 | 2.2 | 2.44 | 2.03 |
| 27.12.2023 | 2.65 | 3.02 | 2.3 |
| 26.12.2023 | 3.42 | 3.62 | 3.02 |
| 25.12.2023 | 4.22 | 4.91 | 3.62 |
© Bayerisches Landesamt für Umwelt 2024