
- Start >
- Rivers >
- Discharge >
- Bayern >
- Unterthingau >
- Chart of year

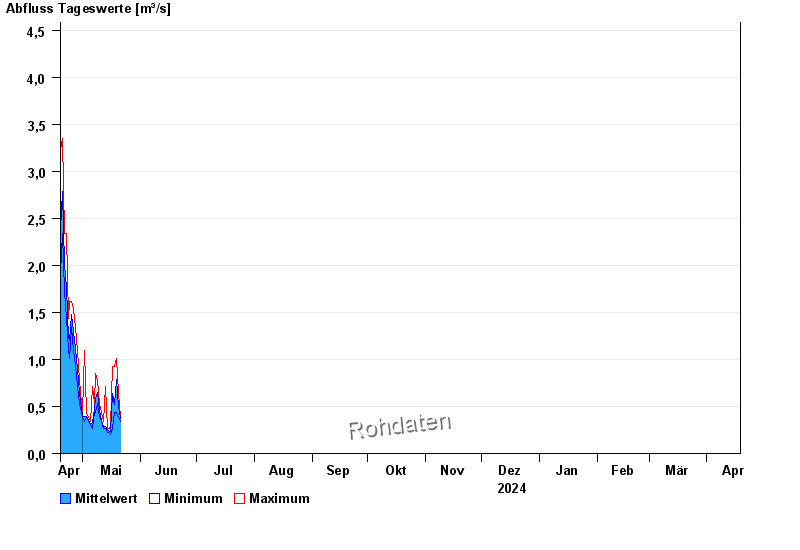
Chart of year Unterthingau / Kirnach
Discharge from 19.04.2024 to 18.04.2025
- 21.05.1999 Abfluss: 49,5 m³/s
- 01.06.2013 Abfluss: 43,7 m³/s
- 30.06.2011 Abfluss: 38,2 m³/s
- 21.09.2000 Abfluss: 38 m³/s
- 12.08.2002 Abfluss: 37,4 m³/s
| Date | Mean value [m³/s] | Maximum [m³/s] | Minimum [m³/s] |
|---|---|---|---|
| 15.06.2024 | 1.46 | 1.62 | 1.43 |
| 14.06.2024 | 1.52 | 1.62 | 1.43 |
| 13.06.2024 | 1.79 | 1.92 | 1.62 |
| 12.06.2024 | 2.3 | 2.66 | 1.92 |
| 11.06.2024 | 3.04 | 3.35 | 2.66 |
| 10.06.2024 | 4.92 | 6.67 | 3.35 |
| 09.06.2024 | 3.33 | 5.99 | 1.82 |
© Bayerisches Landesamt für Umwelt 2024