
- Start >
- Rivers >
- Discharge >
- Bayern >
- Unterthingau >
- Chart of total period

Chart of total period Unterthingau / Kirnach
Discharge from 01.08.2007 to 27.04.2024
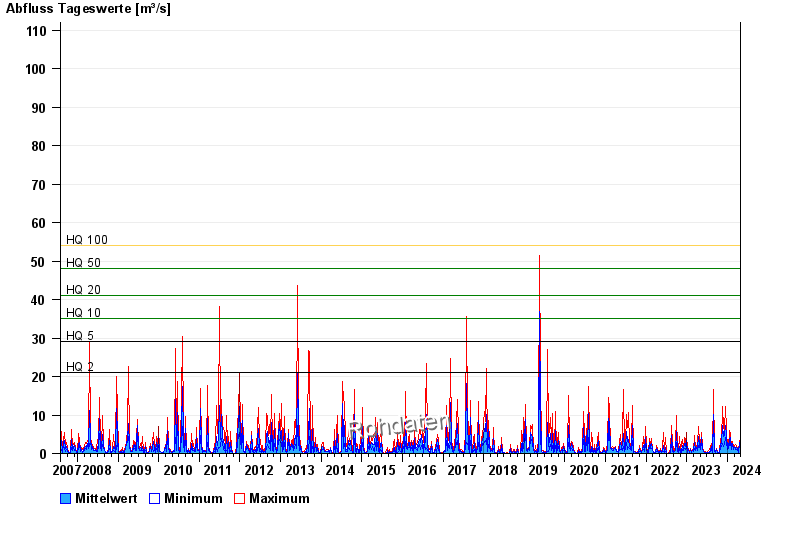
- HQ2 21 m³/s
- HQ5 29 m³/s
- HQ10 35 m³/s
- HQ20 41 m³/s
- HQ50 48 m³/s
- HQ100 54 m³/s
| Date | Mean value [m³/s] | Maximum [m³/s] | Minimum [m³/s] |
|---|---|---|---|
| 27.04.2024 | 1.34 | 1.34 | 1.34 |
| 26.04.2024 | 1.3 | 1.53 | 1.09 |
| 25.04.2024 | 1.48 | 1.62 | 1.34 |
| 24.04.2024 | 1.2 | 1.62 | 1.01 |
| 23.04.2024 | 1.22 | 1.43 | 1.09 |
| 22.04.2024 | 1.76 | 2.34 | 1.43 |
| 21.04.2024 | 2.01 | 2.34 | 1.72 |
© Bayerisches Landesamt für Umwelt 2024