
- Start >
- Rivers >
- Discharge >
- Bayern >
- Untersteinach >
- Chart of total period

Chart of total period Untersteinach / Untere Steinach
Discharge from 01.11.1956 to 02.05.2024
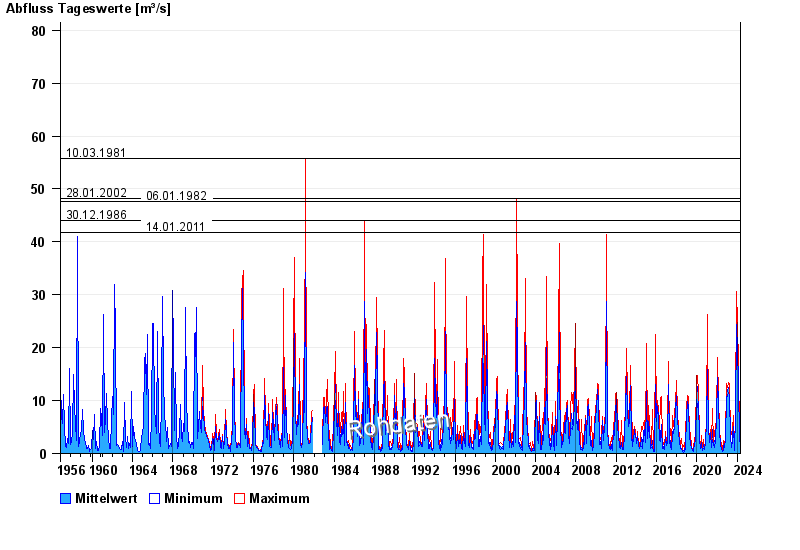
- 10.03.1981 Abfluss: 55,8 m³/s
- 28.01.2002 Abfluss: 48,2 m³/s
- 06.01.1982 Abfluss: 47,7 m³/s
- 30.12.1986 Abfluss: 44 m³/s
- 14.01.2011 Abfluss: 41,7 m³/s
| Date | Mean value [m³/s] | Maximum [m³/s] | Minimum [m³/s] |
|---|---|---|---|
| 02.05.2024 | 1.76 | 1.77 | 1.69 |
| 01.05.2024 | 1.82 | 1.86 | 1.69 |
| 30.04.2024 | 1.92 | 1.94 | 1.86 |
| 29.04.2024 | 2.03 | 2.11 | 1.94 |
| 28.04.2024 | 2.22 | 2.28 | 2.11 |
| 27.04.2024 | 2.46 | 2.65 | 2.28 |
| 26.04.2024 | 2.74 | 2.94 | 2.46 |
© Bayerisches Landesamt für Umwelt 2024