

Chart of year Unternogg / Halbammer
Discharge from 20.04.2024 to 19.04.2025
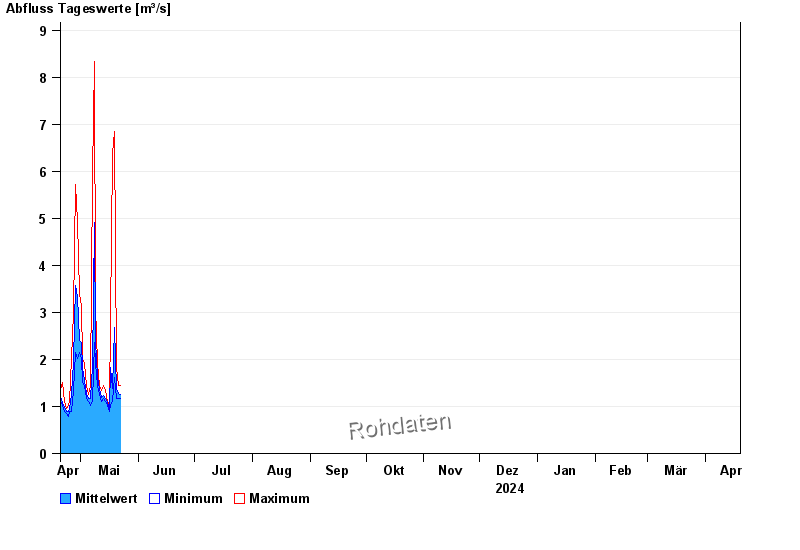
| Date | Mean value [m³/s] | Maximum [m³/s] | Minimum [m³/s] |
|---|---|---|---|
| 02.05.2024 | 2.03 | 2.03 | 2.03 |
| 01.05.2024 | 2.35 | 3.13 | 2.03 |
| 30.04.2024 | 2.41 | 3.41 | 2.14 |
| 29.04.2024 | 3.34 | 4.93 | 2.03 |
| 28.04.2024 | 3.58 | 5.72 | 2.14 |
| 27.04.2024 | 1.95 | 3 | 1.35 |
| 26.04.2024 | 1.26 | 2.03 | 0.902 |
© Bayerisches Landesamt für Umwelt 2024