
- Start >
- Rivers >
- Discharge >
- Bayern >
- Untereppenried >
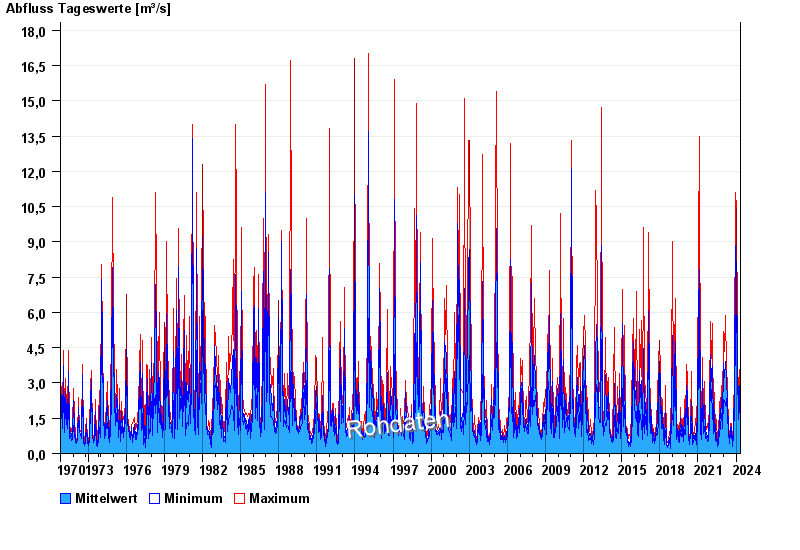
- Chart of total period

Chart of total period Untereppenried / Ascha
Discharge from 01.11.1970 to 07.05.2024
| Date | Mean value [m³/s] | Maximum [m³/s] | Minimum [m³/s] |
|---|---|---|---|
| 07.05.2024 | 0.733 | 0.801 | 0.703 |
| 06.05.2024 | 0.626 | 0.658 | 0.57 |
| 05.05.2024 | 0.651 | 0.703 | 0.57 |
| 04.05.2024 | 0.765 | 0.849 | 0.703 |
| 03.05.2024 | 0.785 | 1.05 | 0.528 |
| 02.05.2024 | 0.528 | 0.57 | 0.486 |
| 01.05.2024 | 0.562 | 0.613 | 0.486 |
© Bayerisches Landesamt für Umwelt 2024