
- Start >
- Rivers >
- Discharge >
- Bayern >
- Unterbruck Flutmulde >
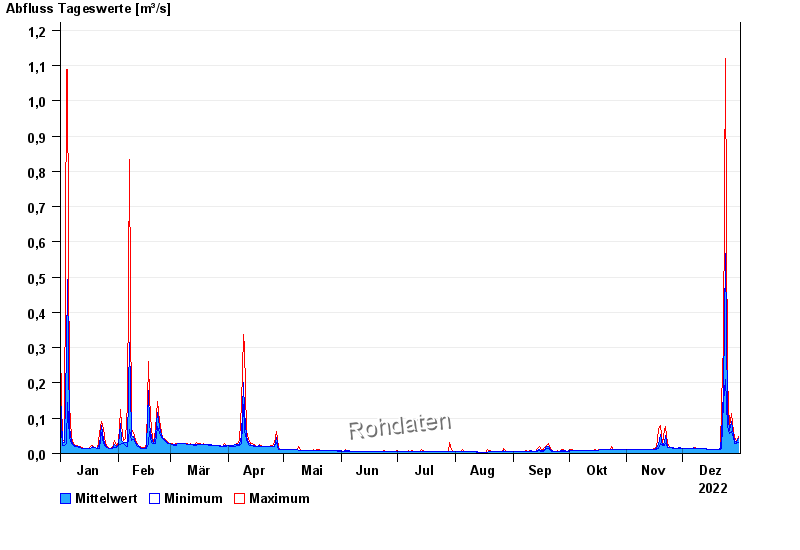
- Chart of year

Chart of year Unterbruck Flutmulde / Haidenaab
Discharge from 01.01.2022 to 31.12.2022
- 26.01.1995 Abfluss: 31,3 m³/s
- 13.02.2005 Abfluss: 25,9 m³/s
- 14.01.2011 Abfluss: 23,4 m³/s
- 31.03.2006 Abfluss: 22,8 m³/s
- 21.12.1993 Abfluss: 21,4 m³/s
| Date | Mean value [m³/s] | Maximum [m³/s] | Minimum [m³/s] |
|---|---|---|---|
| 31.12.2022 | 0.174 | 0.219 | 0.113 |
| 30.12.2022 | 0.107 | 0.122 | 0.089 |
| 29.12.2022 | 0.143 | 0.183 | 0.096 |
| 28.12.2022 | 0.225 | 0.296 | 0.183 |
| 27.12.2022 | 0.456 | 0.575 | 0.296 |
| 26.12.2022 | 0.312 | 0.398 | 0.269 |
| 25.12.2022 | 0.601 | 0.922 | 0.368 |
© Bayerisches Landesamt für Umwelt 2025