
- Start >
- Rivers >
- Discharge >
- Bayern >
- Unterbruck >
- Chart of year

Chart of year Unterbruck / Haidenaab
Discharge from 01.01.2023 to 31.12.2023
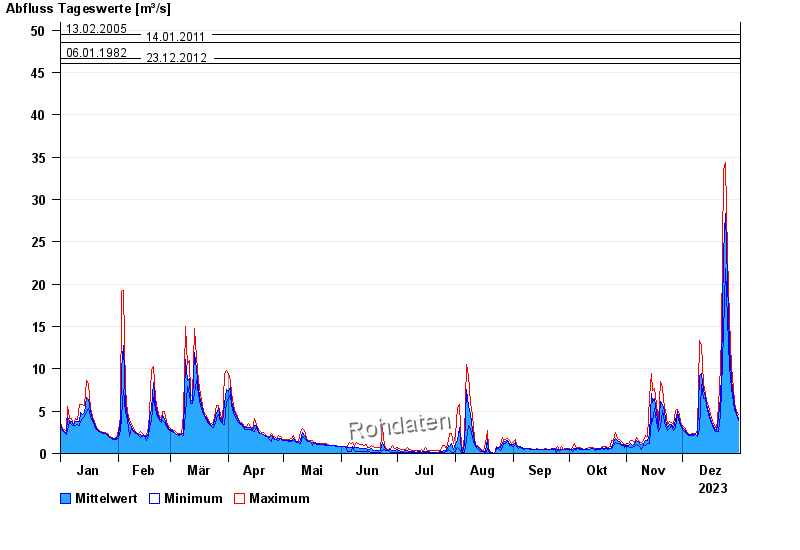
- 28.05.2006 Abfluss: 50,3 m³/s
- 13.02.2005 Abfluss: 49,5 m³/s
- 14.01.2011 Abfluss: 48,5 m³/s
- 06.01.1982 Abfluss: 46,6 m³/s
- 23.12.2012 Abfluss: 46,1 m³/s
| Date | Mean value [m³/s] | Maximum [m³/s] | Minimum [m³/s] |
|---|---|---|---|
| 31.12.2023 | 4.14 | 4.62 | 3.85 |
| 30.12.2023 | 4.76 | 4.93 | 4.62 |
| 29.12.2023 | 5.5 | 6.07 | 5.09 |
| 28.12.2023 | 6.79 | 7.71 | 6.07 |
| 27.12.2023 | 8.75 | 10.3 | 7.71 |
| 26.12.2023 | 12.6 | 15.8 | 10.3 |
| 25.12.2023 | 20.4 | 23.4 | 15.8 |
© Bayerisches Landesamt für Umwelt 2024