
- Start >
- Rivers >
- Discharge >
- Bayern >
- Unterbruck >
- Chart of total period

Chart of total period Unterbruck / Haidenaab
Discharge from 01.11.1976 to 01.05.2024
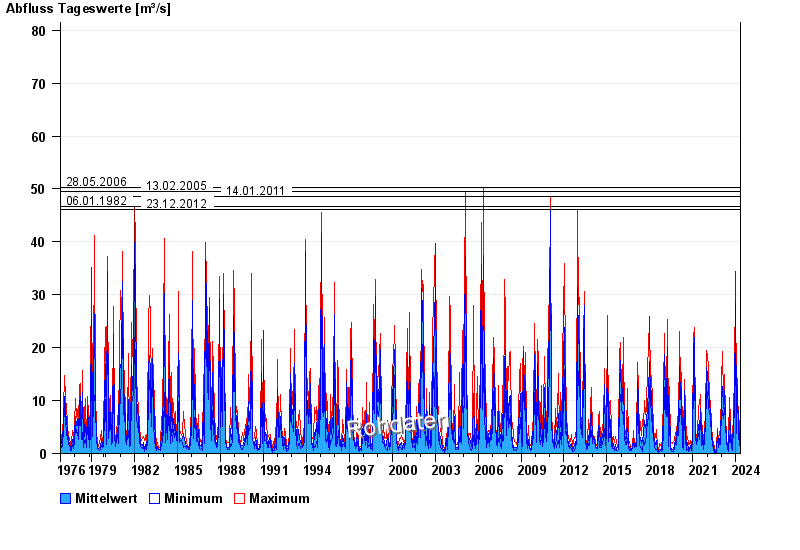
- 28.05.2006 Abfluss: 50,3 m³/s
- 13.02.2005 Abfluss: 49,5 m³/s
- 14.01.2011 Abfluss: 48,5 m³/s
- 06.01.1982 Abfluss: 46,6 m³/s
- 23.12.2012 Abfluss: 46,1 m³/s
| Date | Mean value [m³/s] | Maximum [m³/s] | Minimum [m³/s] |
|---|---|---|---|
| 01.05.2024 | 1.4 | 1.4 | 1.31 |
| 30.04.2024 | 1.55 | 1.58 | 1.4 |
| 29.04.2024 | 1.62 | 1.68 | 1.58 |
| 28.04.2024 | 1.84 | 1.98 | 1.68 |
| 27.04.2024 | 2.05 | 2.2 | 1.88 |
| 26.04.2024 | 2.36 | 2.56 | 2.2 |
| 25.04.2024 | 2.57 | 2.69 | 2.44 |
© Bayerisches Landesamt für Umwelt 2024