

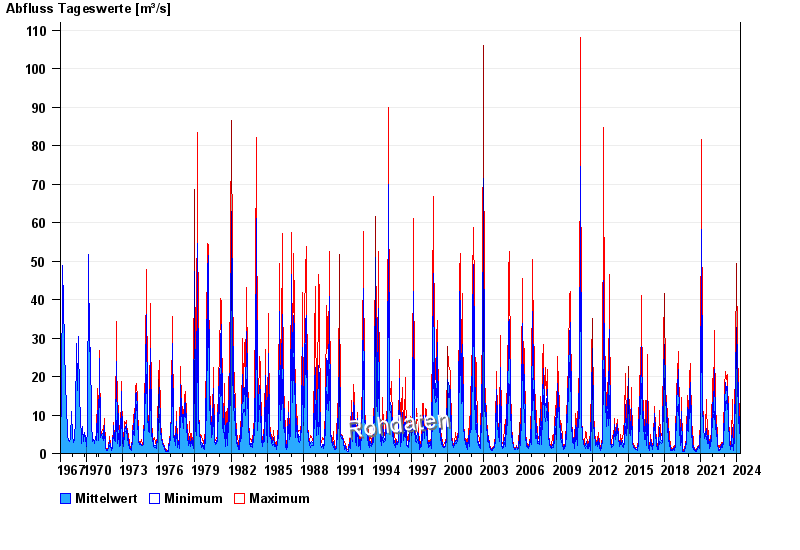
Chart of total period Unsleben / Streu
Discharge from 01.11.1967 to 27.04.2024
| Date | Mean value [m³/s] | Maximum [m³/s] | Minimum [m³/s] |
|---|---|---|---|
| 27.04.2024 | 3.7 | 3.83 | 3.68 |
| 26.04.2024 | 4.01 | 4.14 | 3.83 |
| 25.04.2024 | 4.1 | 4.14 | 3.98 |
| 24.04.2024 | 4.22 | 4.29 | 4.14 |
| 23.04.2024 | 4.48 | 4.76 | 4.14 |
| 22.04.2024 | 4.8 | 5.25 | 4.45 |
| 21.04.2024 | 5.45 | 6.1 | 4.76 |
© Bayerisches Landesamt für Umwelt 2024