

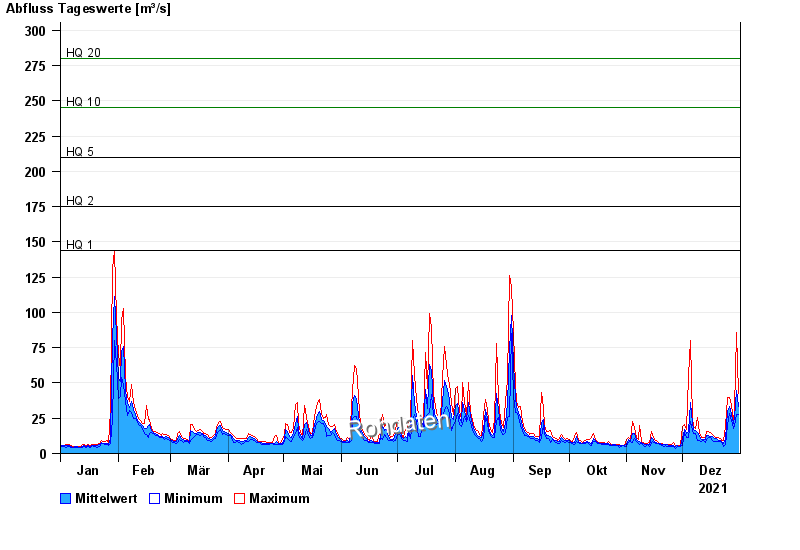
Chart of year Türkheim / Wertach
Discharge from 01.01.2021 to 31.12.2021
note
Beeinflussung durch Kraftwerksbetrieb
- HQ1 144 m³/s
- HQ2 175 m³/s
- HQ5 210 m³/s
- HQ10 245 m³/s
- HQ20 280 m³/s
- HQ50 330 m³/s
- HQ100 370 m³/s
| Date | Mean value [m³/s] | Maximum [m³/s] | Minimum [m³/s] |
|---|---|---|---|
| 31.12.2021 | 33.6 | 42.3 | 27.5 |
| 30.12.2021 | 44.4 | 85.5 | 27.5 |
| 29.12.2021 | 25.6 | 30.9 | 20.1 |
| 28.12.2021 | 21.2 | 23.1 | 17.9 |
| 27.12.2021 | 27.7 | 33.8 | 23.1 |
| 26.12.2021 | 33.1 | 39.8 | 28.2 |
| 25.12.2021 | 29.9 | 39.8 | 19.6 |
© Bayerisches Landesamt für Umwelt 2024