

Chart of year Trostberg / Alz
Discharge from 01.01.2022 to 31.12.2022
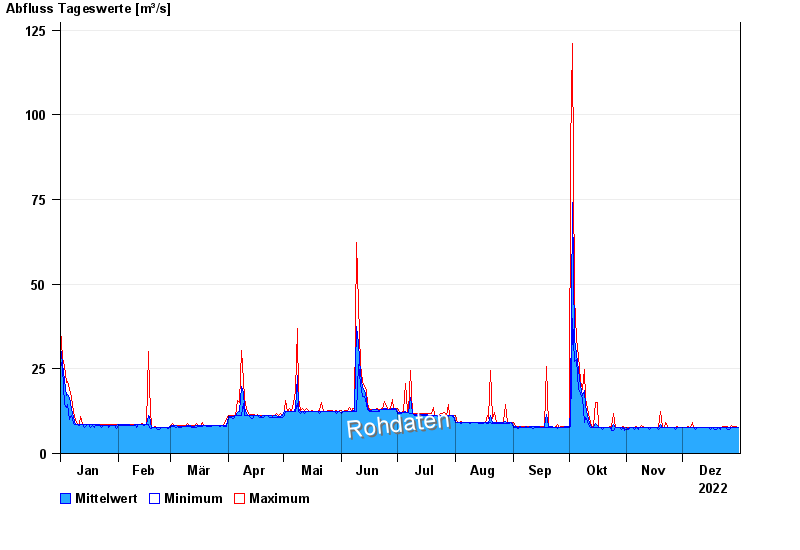
| Date | Mean value [m³/s] | Maximum [m³/s] | Minimum [m³/s] |
|---|---|---|---|
| 31.12.2022 | 7.72 | 7.72 | 7.71 |
| 30.12.2022 | 7.72 | 8.08 | 7.71 |
| 29.12.2022 | 7.72 | 8.07 | 7.71 |
| 28.12.2022 | 7.72 | 8.07 | 7.71 |
| 27.12.2022 | 7.75 | 8.44 | 7.71 |
| 26.12.2022 | 7.7 | 7.71 | 7.35 |
| 25.12.2022 | 7.71 | 8.07 | 7.35 |
© Bayerisches Landesamt für Umwelt 2025