

Chart of year Trostberg / Alz
Discharge from 05.12.2023 to 04.12.2024
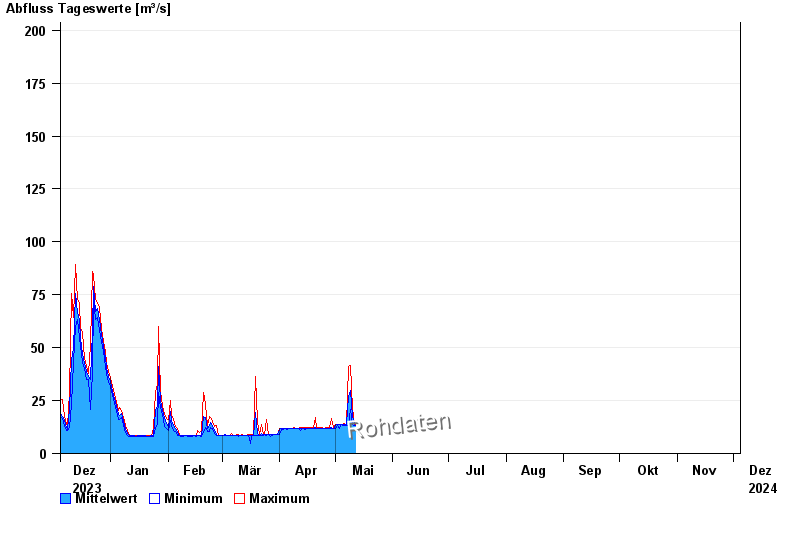 Für diesen Pegel sind keine Jährlichkeiten hinterlegt.
| Date | Mean value [m³/s] | Maximum [m³/s] | Minimum [m³/s] |
|---|---|---|---|
| 24.05.2024 | 21.4 | 27.9 | 14.6 |
| 23.05.2024 | 14.1 | 16.7 | 13.2 |
| 22.05.2024 | 13.4 | 13.4 | 13.4 |
| 21.05.2024 | 13.4 | 13.4 | 13.4 |
| 20.05.2024 | 13.4 | 13.4 | 12.5 |
| 19.05.2024 | 13.4 | 13.9 | 13.4 |
| 18.05.2024 | 13.4 | 13.4 | 13.4 |
© Bayerisches Landesamt für Umwelt 2024