

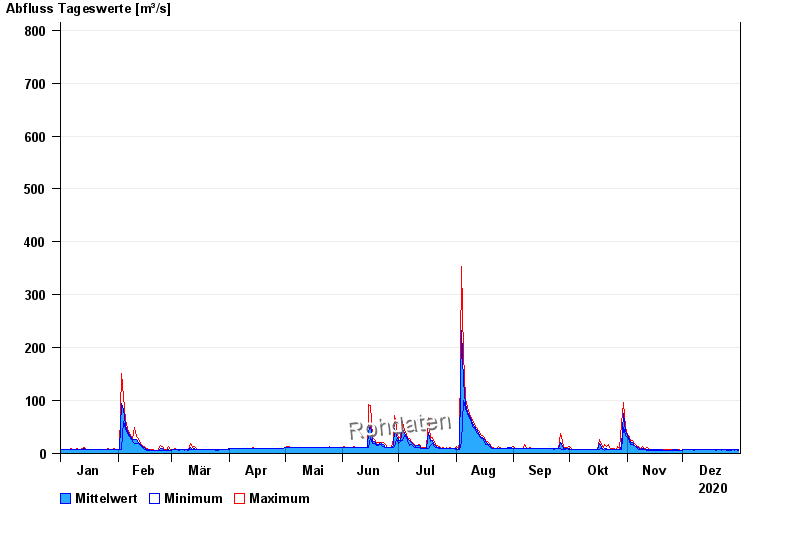
Chart of year Trostberg / Alz
Discharge from 01.01.2020 to 31.12.2020
 Für diesen Pegel sind keine Jährlichkeiten hinterlegt.
| Date | Mean value [m³/s] | Maximum [m³/s] | Minimum [m³/s] |
|---|---|---|---|
| 31.12.2020 | 7.6 | 7.61 | 7.27 |
| 30.12.2020 | 7.62 | 7.62 | 7.61 |
| 29.12.2020 | 7.6 | 7.64 | 7.29 |
| 28.12.2020 | 7.64 | 7.65 | 7.64 |
| 27.12.2020 | 7.65 | 7.66 | 7.31 |
| 26.12.2020 | 7.65 | 7.67 | 7.32 |
| 25.12.2020 | 7.67 | 7.68 | 7.33 |
© Bayerisches Landesamt für Umwelt 2025