

Chart of year Trostberg / Alz
Discharge from 01.01.2017 to 31.12.2017
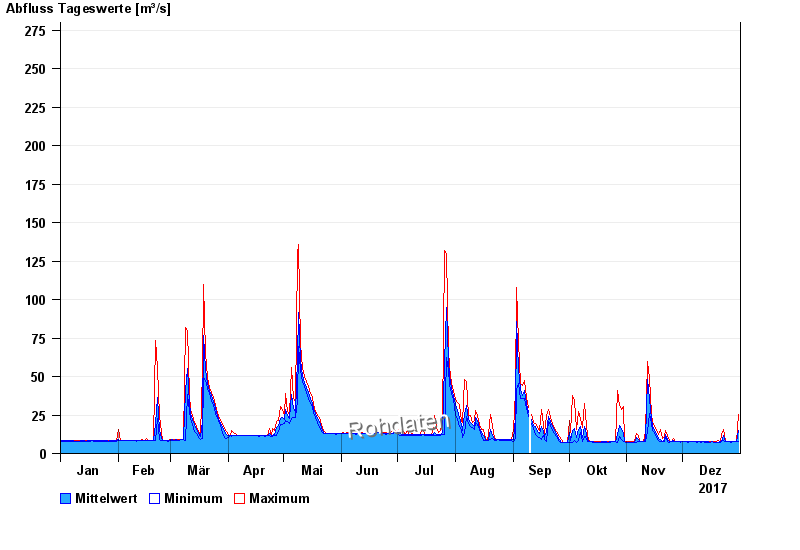 Für diesen Pegel sind keine Jährlichkeiten hinterlegt.
| Date | Mean value [m³/s] | Maximum [m³/s] | Minimum [m³/s] |
|---|---|---|---|
| 31.12.2017 | 15.5 | 25.1 | 7.49 |
| 30.12.2017 | 7.83 | 7.83 | 7.83 |
| 29.12.2017 | 7.8 | 7.83 | 7.48 |
| 28.12.2017 | 7.82 | 7.83 | 7.48 |
| 27.12.2017 | 7.77 | 7.83 | 7.48 |
| 26.12.2017 | 7.8 | 7.82 | 7.47 |
| 25.12.2017 | 7.76 | 7.82 | 7.47 |
© Bayerisches Landesamt für Umwelt 2025