
- Start >
- Rivers >
- Discharge >
- Bayern >
- Treuchtlingen >
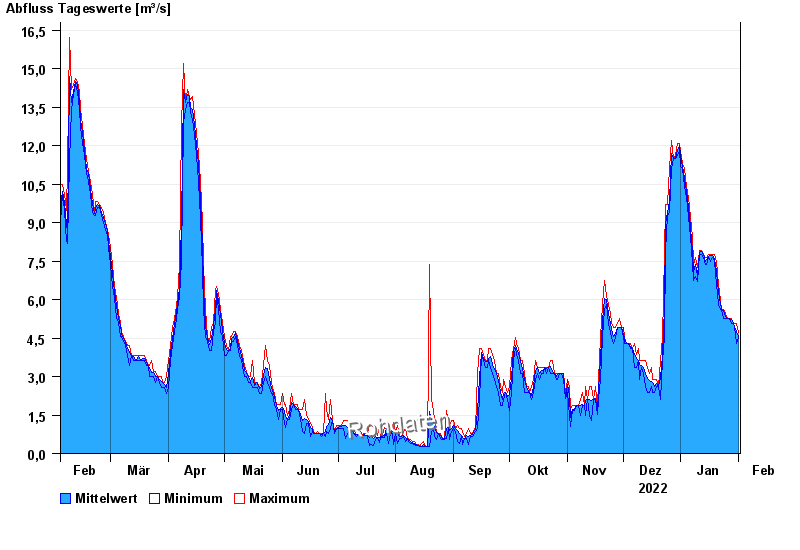
- Chart of year

Chart of year Treuchtlingen / Altmühl
Discharge from 02.02.2022 to 01.02.2023
| Date | Mean value [m³/s] | Maximum [m³/s] | Minimum [m³/s] |
|---|---|---|---|
| 01.02.2023 | 4.58 | 4.7 | 4.51 |
| 31.01.2023 | 4.75 | 5.08 | 4.3 |
| 30.01.2023 | 4.91 | 5.08 | 4.9 |
| 29.01.2023 | 5.08 | 5.08 | 5.08 |
| 28.01.2023 | 5.24 | 5.26 | 5.08 |
| 27.01.2023 | 5.26 | 5.26 | 5.26 |
| 26.01.2023 | 5.26 | 5.26 | 5.26 |
© Bayerisches Landesamt für Umwelt 2024