
- Start >
- Rivers >
- Discharge >
- Bayern >
- Trausnitz u. d. Mühle >
- Chart of year

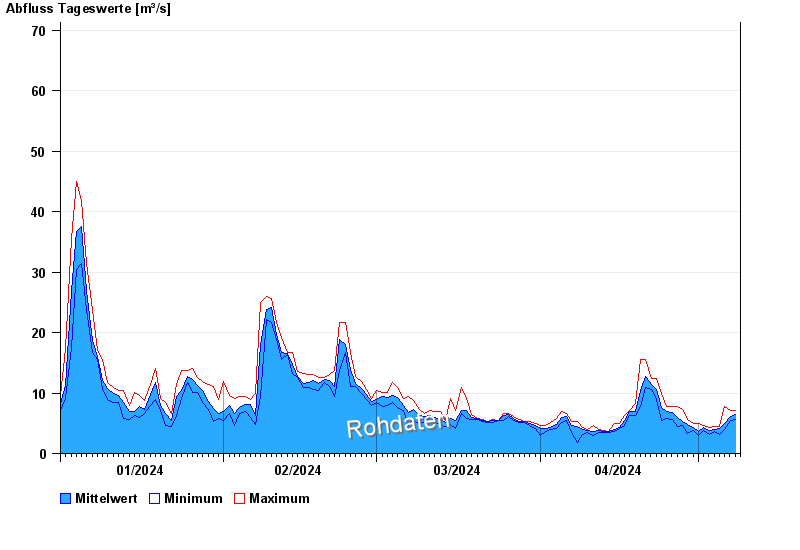
Chart of year Trausnitz u. d. Mühle / Pfreimd
Discharge from 01.01.2024 to 08.05.2024
- 26.01.1995 Abfluss: 87,1 m³/s
- 27.03.1988 Abfluss: 84,3 m³/s
- 03.01.2003 Abfluss: 76,1 m³/s
- 22.12.1993 Abfluss: 73,7 m³/s
- 06.01.1982 Abfluss: 72,7 m³/s
| Date | Mean value [m³/s] | Maximum [m³/s] | Minimum [m³/s] |
|---|---|---|---|
| 08.05.2024 | 6.72 | 7.11 | 6.47 |
| 07.05.2024 | 6.07 | 7.11 | 5.47 |
| 06.05.2024 | 4.89 | 7.77 | 4 |
| 05.05.2024 | 4.11 | 4.53 | 3.2 |
| 04.05.2024 | 3.97 | 4.53 | 3.67 |
| 03.05.2024 | 3.78 | 4.35 | 3.2 |
| 02.05.2024 | 4.24 | 4.71 | 3.83 |
© Bayerisches Landesamt für Umwelt 2024