

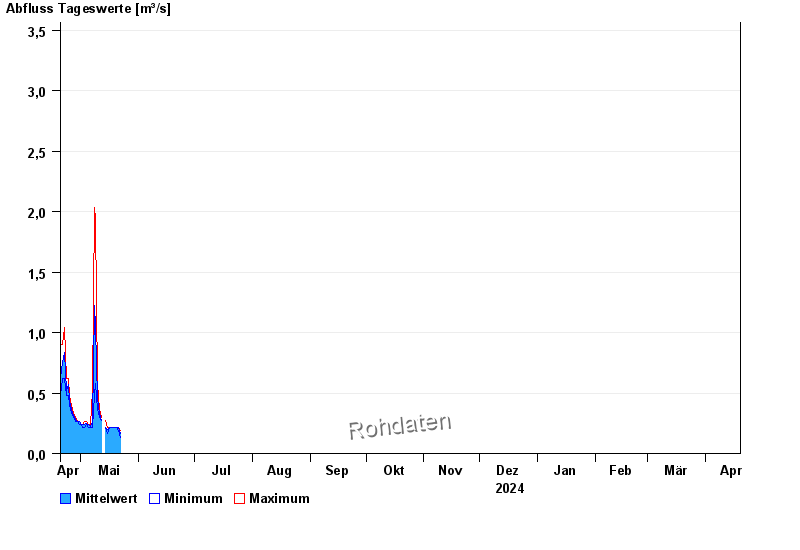
Chart of year Thundorf / Kleine Sur
Discharge from 20.04.2024 to 19.04.2025
- 04.08.2020 Abfluss: 50,5 m³/s
- 12.08.2002 Abfluss: 36,1 m³/s
- 07.08.2002 Abfluss: 30,6 m³/s
- 30.01.1982 Abfluss: 18,7 m³/s
- 06.08.1985 Abfluss: 17,3 m³/s
| Date | Mean value [m³/s] | Maximum [m³/s] | Minimum [m³/s] |
|---|---|---|---|
| 01.05.2024 | 0.241 | 0.241 | 0.241 |
| 30.04.2024 | 0.263 | 0.268 | 0.241 |
| 29.04.2024 | 0.268 | 0.268 | 0.268 |
| 28.04.2024 | 0.282 | 0.298 | 0.268 |
| 27.04.2024 | 0.316 | 0.331 | 0.298 |
| 26.04.2024 | 0.363 | 0.401 | 0.331 |
| 25.04.2024 | 0.431 | 0.481 | 0.401 |
© Bayerisches Landesamt für Umwelt 2024