

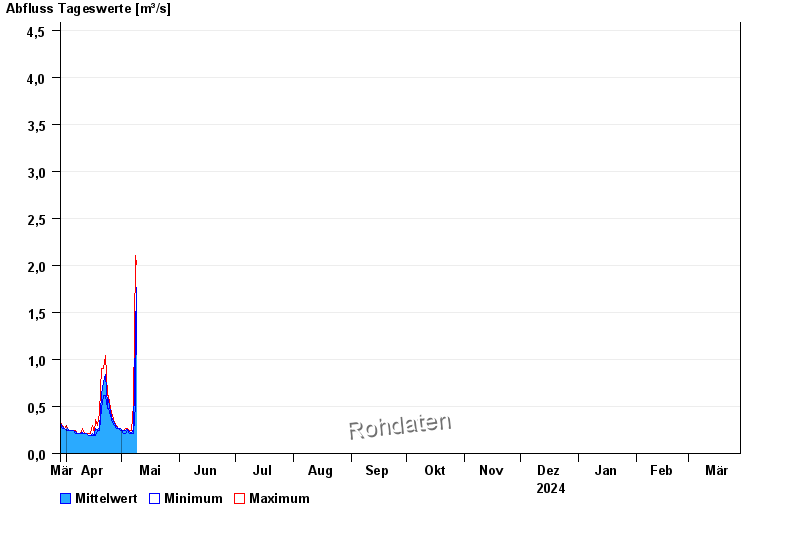
Chart of year Thundorf / Kleine Sur
Discharge from 29.03.2024 to 28.03.2025
- HQ1 9,4 m³/s
- HQ2 11 m³/s
- HQ5 15 m³/s
- HQ10 19 m³/s
- HQ20 24 m³/s
- HQ50 33 m³/s
- HQ100 41 m³/s
| Date | Mean value [m³/s] | Maximum [m³/s] | Minimum [m³/s] |
|---|---|---|---|
| 27.04.2024 | 0.331 | 0.331 | 0.331 |
| 26.04.2024 | 0.363 | 0.401 | 0.331 |
| 25.04.2024 | 0.431 | 0.481 | 0.401 |
| 24.04.2024 | 0.571 | 0.619 | 0.481 |
| 23.04.2024 | 0.517 | 0.619 | 0.481 |
| 22.04.2024 | 0.837 | 1.04 | 0.619 |
| 21.04.2024 | 0.753 | 0.902 | 0.619 |
© Bayerisches Landesamt für Umwelt 2024