

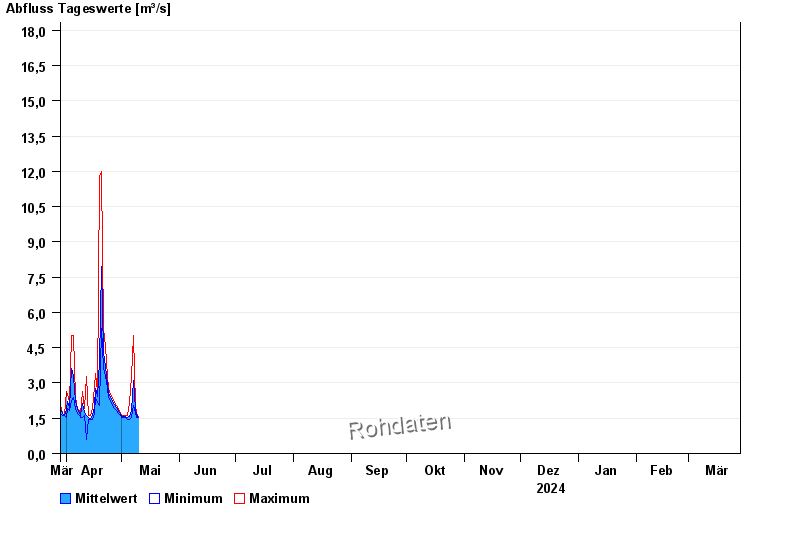
Chart of year Teisnach / Teisnach
Discharge from 29.03.2024 to 28.03.2025
- 01.11.1998 Abfluss: 87,6 m³/s
- 05.12.1988 Abfluss: 79,7 m³/s
- 15.09.1998 Abfluss: 73,7 m³/s
- 23.12.1967 Abfluss: 71,7 m³/s
- 29.10.1998 Abfluss: 67,3 m³/s
| Date | Mean value [m³/s] | Maximum [m³/s] | Minimum [m³/s] |
|---|---|---|---|
| 09.05.2024 | 1.71 | 1.72 | 1.62 |
| 08.05.2024 | 1.86 | 2.04 | 1.72 |
| 07.05.2024 | 3.12 | 5 | 2.04 |
| 06.05.2024 | 1.84 | 3.26 | 1.52 |
| 05.05.2024 | 1.58 | 2.15 | 1.43 |
| 04.05.2024 | 1.53 | 1.62 | 1.43 |
| 03.05.2024 | 1.57 | 1.62 | 1.52 |
© Bayerisches Landesamt für Umwelt 2024