

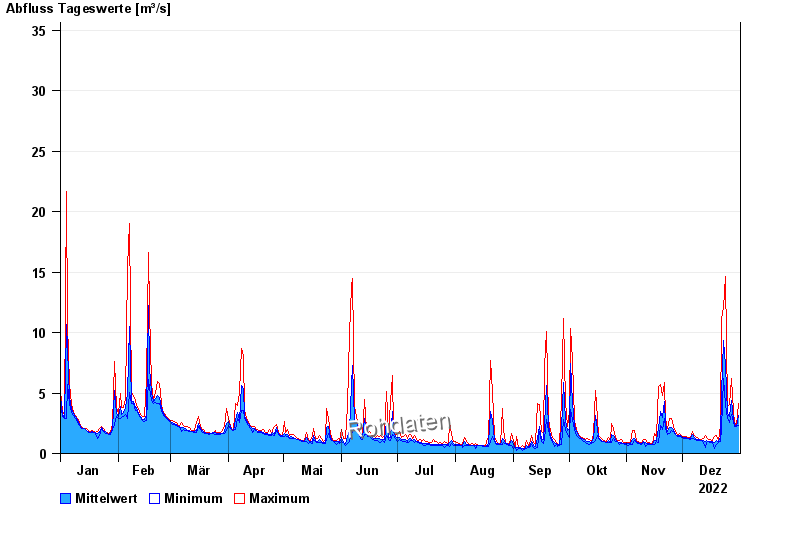
Chart of year Teisnach / Teisnach
Discharge from 01.01.2022 to 31.12.2022
- 01.11.1998 Abfluss: 87,6 m³/s
- 05.12.1988 Abfluss: 79,7 m³/s
- 15.09.1998 Abfluss: 73,7 m³/s
- 23.12.1967 Abfluss: 71,7 m³/s
- 29.10.1998 Abfluss: 67,3 m³/s
| Date | Mean value [m³/s] | Maximum [m³/s] | Minimum [m³/s] |
|---|---|---|---|
| 31.12.2022 | 3.12 | 4.17 | 2.33 |
| 30.12.2022 | 2.24 | 2.33 | 2.21 |
| 29.12.2022 | 2.37 | 2.56 | 2.21 |
| 28.12.2022 | 2.76 | 3.46 | 2.56 |
| 27.12.2022 | 4.37 | 6.2 | 3.19 |
| 26.12.2022 | 3.08 | 4.02 | 2.56 |
| 25.12.2022 | 3.32 | 3.88 | 2.93 |
© Bayerisches Landesamt für Umwelt 2024