

Chart of total period Teisnach / Teisnach
Discharge from 01.11.1953 to 26.04.2024
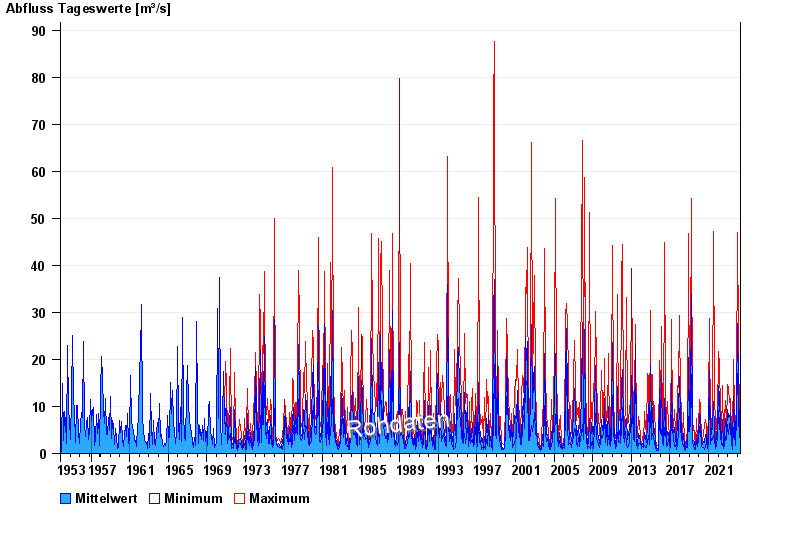
| Date | Mean value [m³/s] | Maximum [m³/s] | Minimum [m³/s] |
|---|---|---|---|
| 26.04.2024 | 2.24 | 2.38 | 2.15 |
| 25.04.2024 | 2.4 | 2.5 | 2.27 |
| 24.04.2024 | 2.58 | 2.75 | 2.38 |
| 23.04.2024 | 2.93 | 3.26 | 2.75 |
| 22.04.2024 | 3.71 | 4.54 | 3.26 |
| 21.04.2024 | 4.28 | 5.32 | 3.67 |
| 20.04.2024 | 7.97 | 12 | 5.32 |
© Bayerisches Landesamt für Umwelt 2024