

Chart of total period Tanzmühle / Pfreimd
Discharge from 28.01.2002 to 05.06.2013
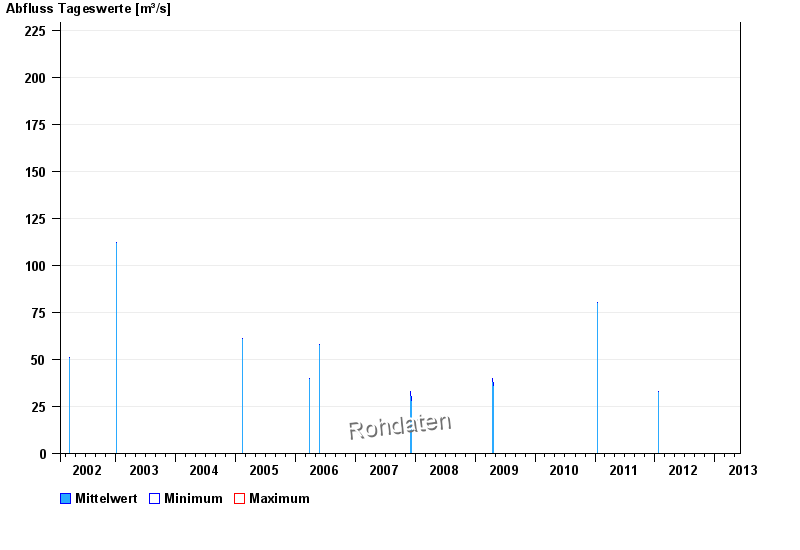 Für diesen Pegel sind keine Jährlichkeiten hinterlegt.
| Date | Mean value [m³/s] | Maximum [m³/s] | Minimum [m³/s] |
|---|---|---|---|
| 05.06.2013 | 31 | 31 | 31 |
| 04.06.2013 | 13 | 13 | 13 |
| 03.06.2013 | 48.5 | 55 | 42 |
| 02.06.2013 | -- | -- | -- |
| 01.06.2013 | -- | -- | -- |
| 31.05.2013 | -- | -- | -- |
| 30.05.2013 | -- | -- | -- |
© Bayerisches Landesamt für Umwelt 2024