
- Start >
- Rivers >
- Discharge >
- Bayern >
- Sylvensteinsee Abfluss >
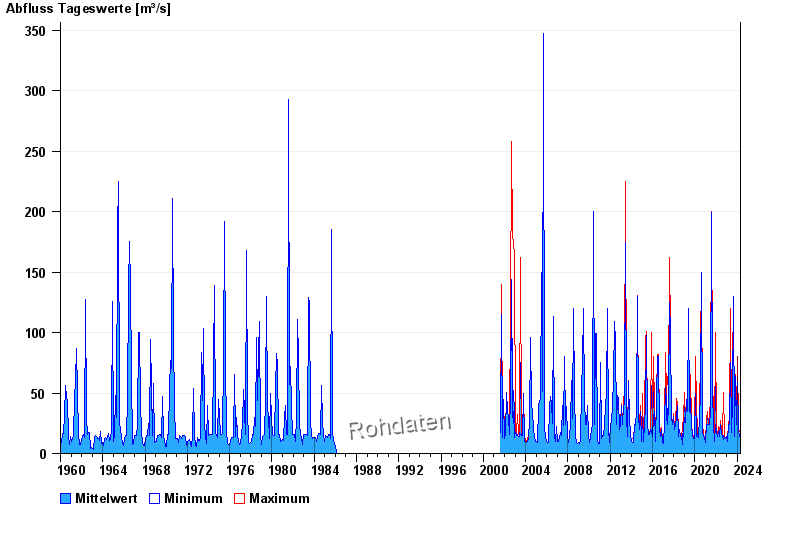
- Chart of total period

Chart of total period Sylvensteinsee Abfluss / Sylvensteinsee
Discharge from 01.01.1960 to 27.04.2024
 Für diesen Pegel sind keine Hauptwerte hinterlegt.
| Date | Mean value [m³/s] | Maximum [m³/s] | Minimum [m³/s] |
|---|---|---|---|
| 27.04.2024 | 18.1 | 18.1 | 18 |
| 26.04.2024 | 18.1 | 20.4 | 18 |
| 25.04.2024 | 15.8 | 18.1 | 14 |
| 24.04.2024 | 14 | 14 | 14 |
| 23.04.2024 | 14 | 14 | 14 |
| 22.04.2024 | 13.2 | 14 | 12 |
| 21.04.2024 | 12.1 | 12.1 | 12 |
© Bayerisches Landesamt für Umwelt 2024