
- Start >
- Rivers >
- Discharge >
- Bayern >
- Sylvenstein >
- Chart of total period

Chart of total period Sylvenstein / Isar
Discharge from 01.11.1949 to 16.12.2025
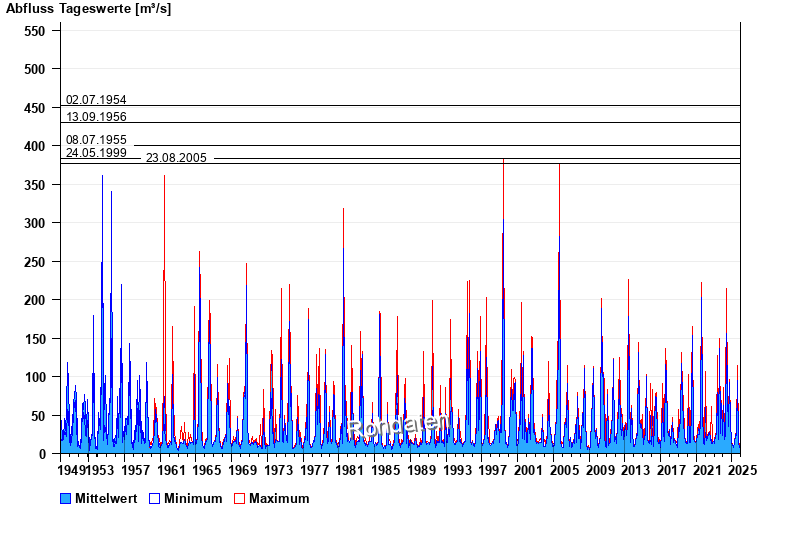
- 02.07.1954 Abfluss: 452 m³/s
- 13.09.1956 Abfluss: 430 m³/s
- 08.07.1955 Abfluss: 400 m³/s
- 24.05.1999 Abfluss: 383 m³/s
- 23.08.2005 Abfluss: 377 m³/s
| Date | Mean value [m³/s] | Maximum [m³/s] | Minimum [m³/s] |
|---|---|---|---|
| 16.12.2025 | 6.65 | 6.65 | 6.65 |
| 15.12.2025 | 6.65 | 6.65 | 6.65 |
| 14.12.2025 | 6.65 | 6.65 | 6.65 |
| 13.12.2025 | 6.65 | 6.65 | 6.65 |
| 12.12.2025 | 6.68 | 7.15 | 6.65 |
| 11.12.2025 | 6.65 | 6.65 | 6.65 |
| 10.12.2025 | 7.05 | 7.15 | 6.65 |
© Bayerisches Landesamt für Umwelt 2025