

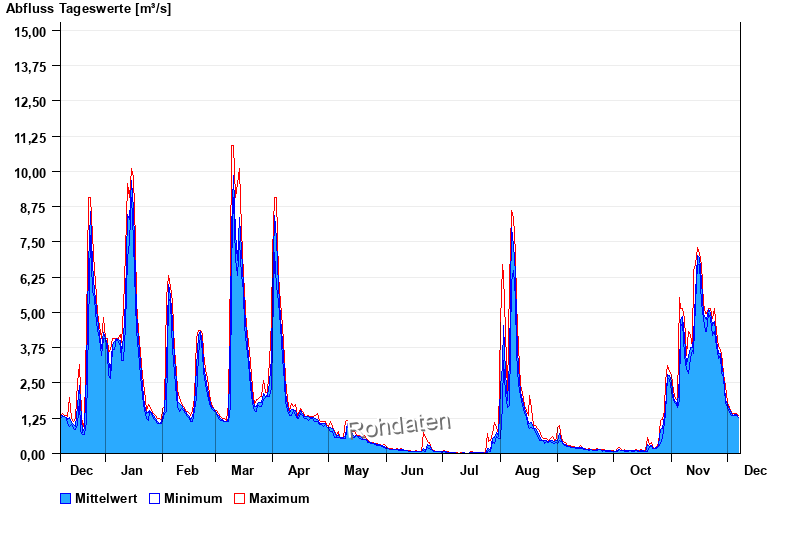
Chart of year Steinberg / Kronach
Discharge from 08.12.2022 to 07.12.2023
- 28.12.1947 Abfluss: 58,4 m³/s
- 02.03.1999 Abfluss: 51 m³/s
- 10.03.1981 Abfluss: 47,6 m³/s
- 03.01.2003 Abfluss: 45,5 m³/s
- 06.01.1982 Abfluss: 43,4 m³/s
| Date | Mean value [m³/s] | Maximum [m³/s] | Minimum [m³/s] |
|---|---|---|---|
| 07.12.2023 | 1.29 | 1.33 | 1.27 |
| 06.12.2023 | 1.37 | 1.4 | 1.33 |
| 05.12.2023 | 1.38 | 1.4 | 1.33 |
| 04.12.2023 | 1.35 | 1.4 | 1.33 |
| 03.12.2023 | 1.4 | 1.46 | 1.33 |
| 02.12.2023 | 1.56 | 1.64 | 1.46 |
| 01.12.2023 | 1.74 | 1.82 | 1.64 |
© Bayerisches Landesamt für Umwelt 2025