

Chart of total period Steinberg / Kronach
Discharge from 01.11.1947 to 09.05.2024
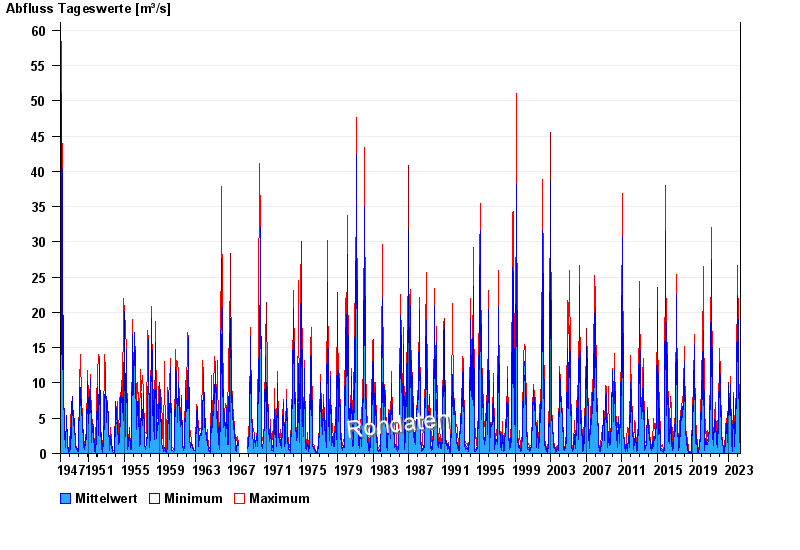
| Date | Mean value [m³/s] | Maximum [m³/s] | Minimum [m³/s] |
|---|---|---|---|
| 09.05.2024 | 1.22 | 1.22 | 1.22 |
| 08.05.2024 | 1.29 | 1.46 | 1.22 |
| 07.05.2024 | 1.55 | 1.7 | 1.46 |
| 06.05.2024 | 1.24 | 1.52 | 1.16 |
| 05.05.2024 | 1.21 | 1.33 | 1.16 |
| 04.05.2024 | 1.21 | 1.27 | 1.16 |
| 03.05.2024 | 1.36 | 1.46 | 1.22 |
© Bayerisches Landesamt für Umwelt 2024