
- Start >
- Rivers >
- Discharge >
- Bayern >
- Steinbach Q >
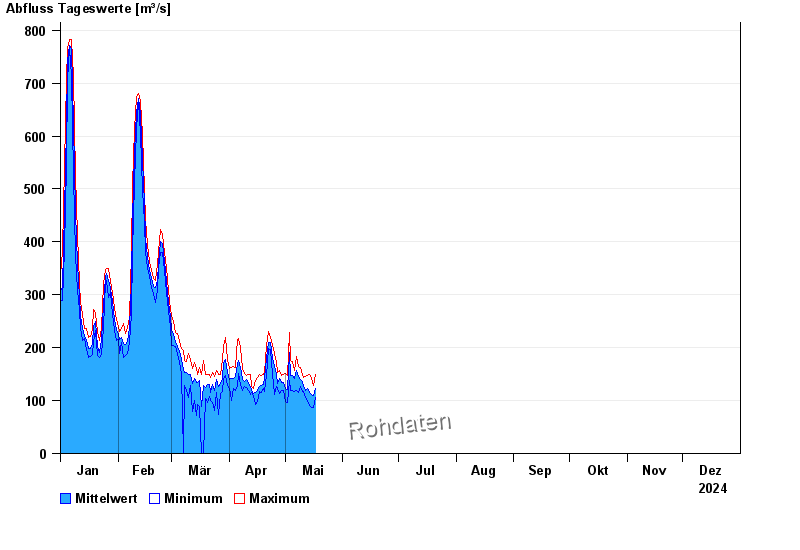
- Chart of year

Chart of year Steinbach Q / Main
Discharge from 01.01.2024 to 31.12.2024
note
Ultraschallanlage; kein Hochwasserpegel
| Date | Mean value [m³/s] | Maximum [m³/s] | Minimum [m³/s] |
|---|---|---|---|
| 09.06.2024 | 155 | 172 | 140 |
| 08.06.2024 | 214 | 243 | 161 |
| 07.06.2024 | 266 | 293 | 245 |
| 06.06.2024 | 335 | 386 | 293 |
| 05.06.2024 | 425 | 455 | 388 |
| 04.06.2024 | 420 | 450 | 397 |
| 03.06.2024 | 373 | 414 | 327 |
© Bayerisches Landesamt für Umwelt 2024