

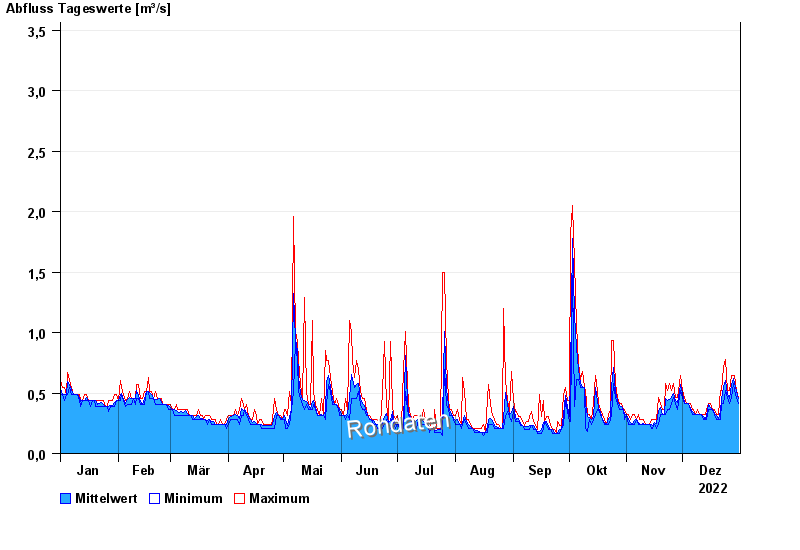
Chart of year Starnberg / Georgenbach
Discharge from 01.01.2022 to 31.12.2022
- 22.05.1999 Abfluss: 17,3 m³/s
- 03.06.2013 Abfluss: 14,9 m³/s
- 18.06.1979 Abfluss: 11 m³/s
- 07.08.2010 Abfluss: 10,7 m³/s
- 23.08.2005 Abfluss: 9,15 m³/s
| Date | Mean value [m³/s] | Maximum [m³/s] | Minimum [m³/s] |
|---|---|---|---|
| 31.12.2022 | 0.451 | 0.461 | 0.41 |
| 30.12.2022 | 0.514 | 0.517 | 0.461 |
| 29.12.2022 | 0.575 | 0.641 | 0.517 |
| 28.12.2022 | 0.621 | 0.641 | 0.576 |
| 27.12.2022 | 0.572 | 0.641 | 0.461 |
| 26.12.2022 | 0.455 | 0.517 | 0.41 |
| 25.12.2022 | 0.49 | 0.517 | 0.461 |
© Bayerisches Landesamt für Umwelt 2024