

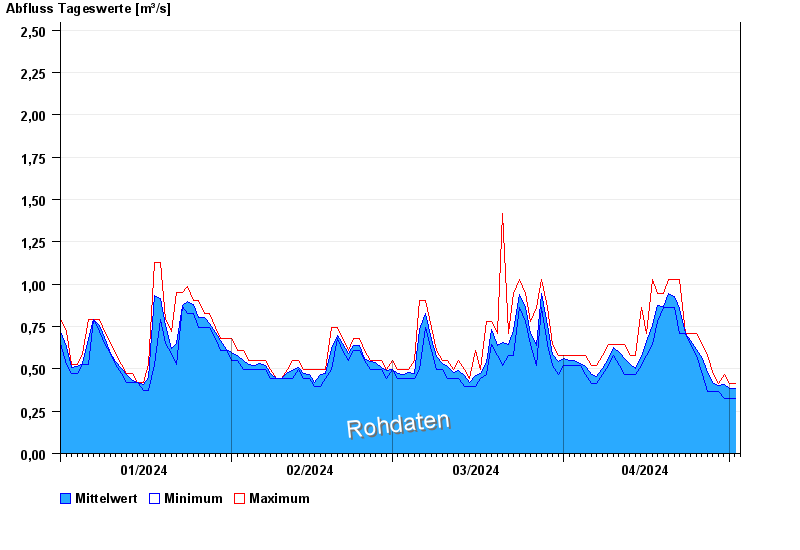
Chart of year Starnberg / Georgenbach
Discharge from 01.01.2024 to 02.05.2024
- 22.05.1999 Abfluss: 17,3 m³/s
- 03.06.2013 Abfluss: 14,9 m³/s
- 18.06.1979 Abfluss: 11 m³/s
- 07.08.2010 Abfluss: 10,7 m³/s
- 23.08.2005 Abfluss: 9,15 m³/s
| Date | Mean value [m³/s] | Maximum [m³/s] | Minimum [m³/s] |
|---|---|---|---|
| 02.05.2024 | 0.383 | 0.416 | 0.369 |
| 01.05.2024 | 0.384 | 0.416 | 0.326 |
| 30.04.2024 | 0.408 | 0.466 | 0.326 |
| 29.04.2024 | 0.402 | 0.416 | 0.369 |
| 28.04.2024 | 0.414 | 0.466 | 0.369 |
| 27.04.2024 | 0.479 | 0.579 | 0.369 |
| 26.04.2024 | 0.564 | 0.642 | 0.466 |
© Bayerisches Landesamt für Umwelt 2024