

Chart of year Sonthofen / Iller
Discharge from 01.01.2021 to 31.12.2021
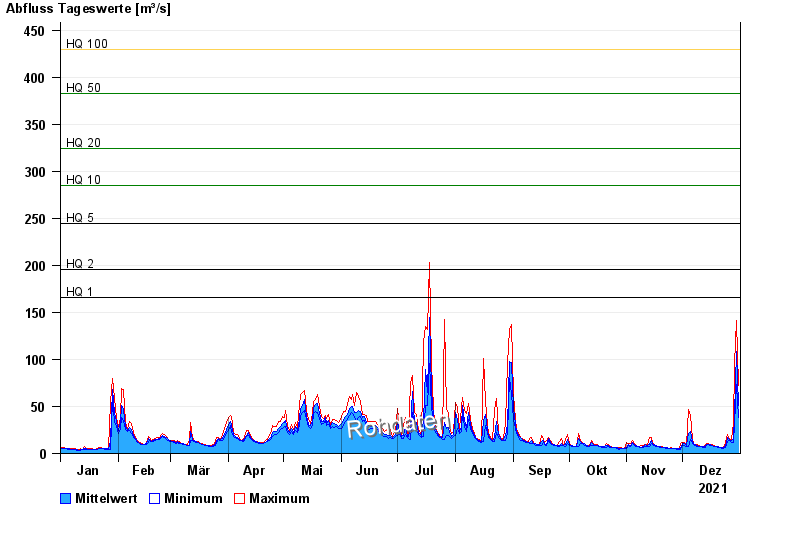
- HQ1 166 m³/s
- HQ2 196 m³/s
- HQ5 245 m³/s
- HQ10 285 m³/s
- HQ20 324 m³/s
- HQ50 383 m³/s
- HQ100 430 m³/s
| Date | Mean value [m³/s] | Maximum [m³/s] | Minimum [m³/s] |
|---|---|---|---|
| 31.12.2021 | 50.9 | 72.4 | 38.8 |
| 30.12.2021 | 109 | 145 | 72.4 |
| 29.12.2021 | 41.6 | 99.5 | 32.6 |
| 28.12.2021 | 16.9 | 32.7 | 12.7 |
| 27.12.2021 | 14.1 | 15.4 | 12.7 |
| 26.12.2021 | 15.3 | 16 | 14.3 |
| 25.12.2021 | 17.5 | 21.1 | 13.2 |
© Bayerisches Landesamt für Umwelt 2025