

Chart of year Siegsdorf / Weiße Traun
Discharge from 18.08.2022 to 17.08.2023
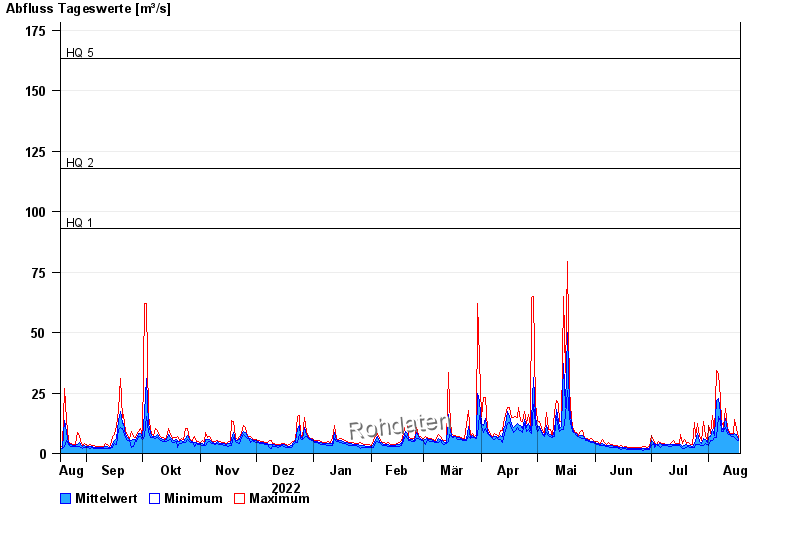
- HQ1 93 m³/s
- HQ2 118 m³/s
- HQ5 163 m³/s
- HQ10 191 m³/s
- HQ20 223 m³/s
- HQ100 300 m³/s
| Date | Mean value [m³/s] | Maximum [m³/s] | Minimum [m³/s] |
|---|---|---|---|
| 17.08.2023 | 5.99 | 6.5 | 5.42 |
| 16.08.2023 | 7.69 | 10.5 | 5.95 |
| 15.08.2023 | 8.17 | 14 | 6.78 |
| 14.08.2023 | 7.72 | 8.36 | 7.08 |
| 13.08.2023 | 7.74 | 8.36 | 7.08 |
| 12.08.2023 | 8.39 | 8.7 | 7.69 |
| 11.08.2023 | 9.6 | 10.9 | 8.36 |
© Bayerisches Landesamt für Umwelt 2024