

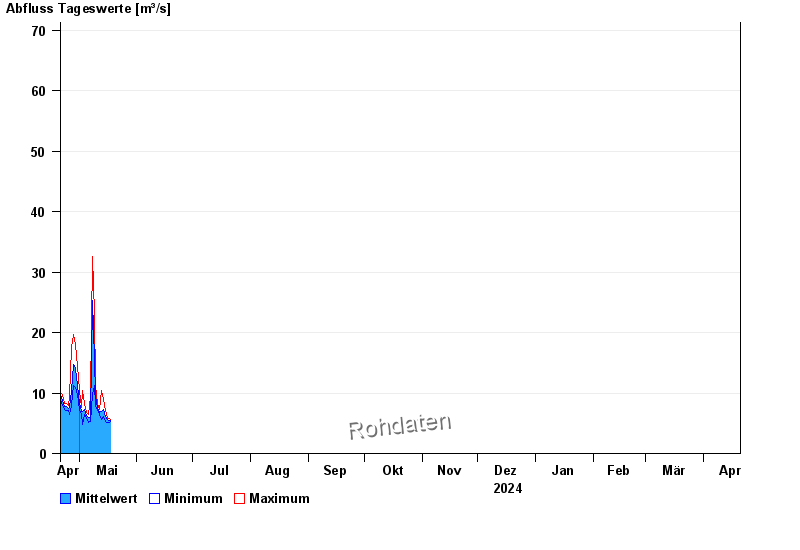
Chart of year Siegsdorf / Weiße Traun
Discharge from 21.04.2024 to 20.04.2025
- HQ1 93 m³/s
- HQ2 118 m³/s
- HQ5 163 m³/s
- HQ10 191 m³/s
- HQ20 223 m³/s
- HQ100 300 m³/s
| Date | Mean value [m³/s] | Maximum [m³/s] | Minimum [m³/s] |
|---|---|---|---|
| 03.05.2024 | 6.62 | 10.5 | 4.85 |
| 02.05.2024 | 7.02 | 7.65 | 6.42 |
| 01.05.2024 | 8.33 | 10.5 | 7.34 |
| 30.04.2024 | 11.2 | 14.4 | 9.75 |
| 29.04.2024 | 14 | 18 | 10.9 |
| 28.04.2024 | 14.8 | 19.7 | 11.3 |
| 27.04.2024 | 10.4 | 17.5 | 7.96 |
© Bayerisches Landesamt für Umwelt 2024