

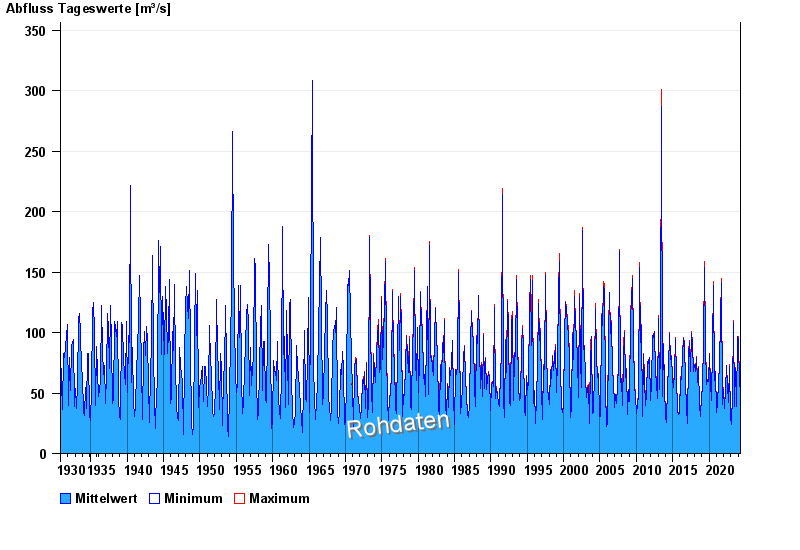
Chart of total period Seebruck / Alz
Discharge from 01.11.1930 to 29.04.2024
| Date | Mean value [m³/s] | Maximum [m³/s] | Minimum [m³/s] |
|---|---|---|---|
| 29.04.2024 | 55.1 | 56 | 54.1 |
| 28.04.2024 | 54 | 55.1 | 53.2 |
| 27.04.2024 | 53.2 | 53.2 | 53.2 |
| 26.04.2024 | 53.5 | 54.1 | 53.2 |
| 25.04.2024 | 54.2 | 55.1 | 54.1 |
| 24.04.2024 | 55 | 55.1 | 54.1 |
| 23.04.2024 | 53.2 | 55.1 | 49.5 |
© Bayerisches Landesamt für Umwelt 2024