

Chart of year Schwabach / Schwabach
Discharge from 10.12.2025 to 09.12.2026
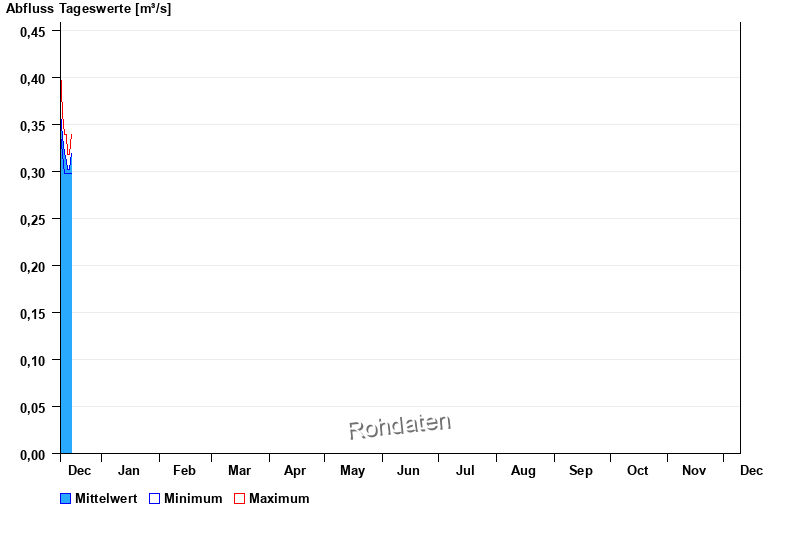
| Date | Mean value [m³/s] | Maximum [m³/s] | Minimum [m³/s] |
|---|---|---|---|
| 16.12.2025 | 0.307 | 0.318 | 0.298 |
| 15.12.2025 | 0.302 | 0.318 | 0.298 |
| 14.12.2025 | 0.302 | 0.318 | 0.298 |
| 13.12.2025 | 0.312 | 0.339 | 0.298 |
| 12.12.2025 | 0.319 | 0.339 | 0.298 |
| 11.12.2025 | 0.336 | 0.361 | 0.318 |
| 10.12.2025 | 0.362 | 0.409 | 0.339 |
© Bayerisches Landesamt für Umwelt 2025