

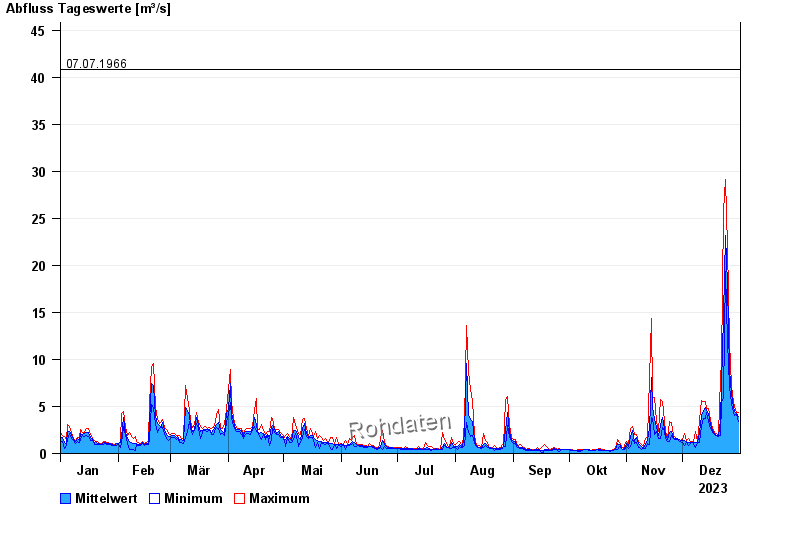
Chart of year Schönberg / Große Ohe
Discharge from 01.01.2023 to 31.12.2023
- 13.08.2002 Abfluss: 57,7 m³/s
- 21.12.1993 Abfluss: 52,5 m³/s
- 22.07.1980 Abfluss: 50,3 m³/s
- 30.06.1966 Abfluss: 45,5 m³/s
- 07.07.1966 Abfluss: 40,8 m³/s
| Date | Mean value [m³/s] | Maximum [m³/s] | Minimum [m³/s] |
|---|---|---|---|
| 31.12.2023 | 3.9 | 4.41 | 3.38 |
| 30.12.2023 | 4.23 | 4.41 | 4.12 |
| 29.12.2023 | 4.44 | 5 | 4.03 |
| 28.12.2023 | 4.9 | 5.5 | 4.32 |
| 27.12.2023 | 6.37 | 7.16 | 5.3 |
| 26.12.2023 | 8.85 | 11.9 | 7.16 |
| 25.12.2023 | 18 | 22 | 11.9 |
© Bayerisches Landesamt für Umwelt 2024