
- Start >
- Rivers >
- Discharge >
- Bayern >
- Schneizlreuth Weißbach >
- Chart of year

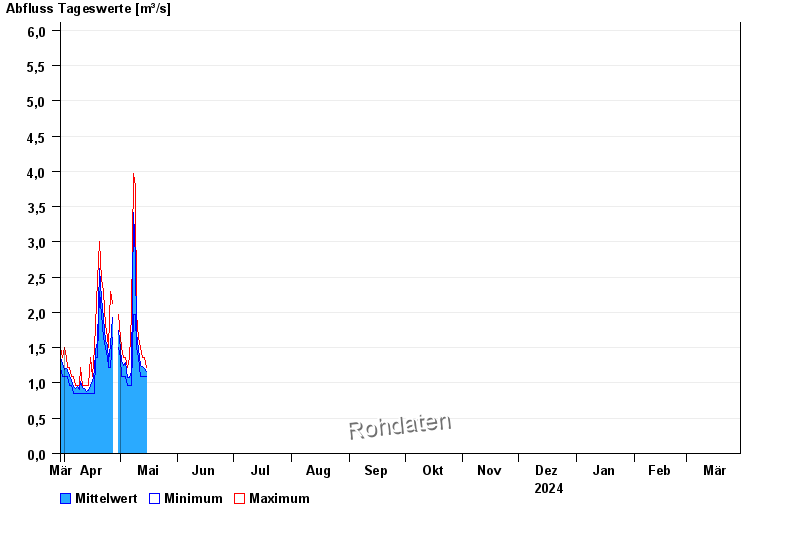
Chart of year Schneizlreuth Weißbach / Weißbach
Discharge from 30.03.2024 to 29.03.2025
- 02.06.2013 Abfluss: 60,1 m³/s
- 26.06.1995 Abfluss: 55,7 m³/s
- 01.08.1977 Abfluss: 52 m³/s
- 07.08.1985 Abfluss: 47,2 m³/s
- 11.07.2005 Abfluss: 46,8 m³/s
| Date | Mean value [m³/s] | Maximum [m³/s] | Minimum [m³/s] |
|---|---|---|---|
| 30.05.2024 | 1.22 | 1.22 | 1.22 |
| 29.05.2024 | 1.34 | 1.5 | 1.22 |
| 28.05.2024 | 1.36 | 1.5 | 1.09 |
| 27.05.2024 | 1.29 | 1.5 | 1.09 |
| 26.05.2024 | 1.62 | 1.97 | 1.36 |
| 25.05.2024 | 1.53 | 2.3 | 1.22 |
| 24.05.2024 | 1.89 | 2.65 | 1.5 |
© Bayerisches Landesamt für Umwelt 2024