

Chart of year Schmerold / Mangfall
Discharge from 25.03.2022 to 24.03.2023
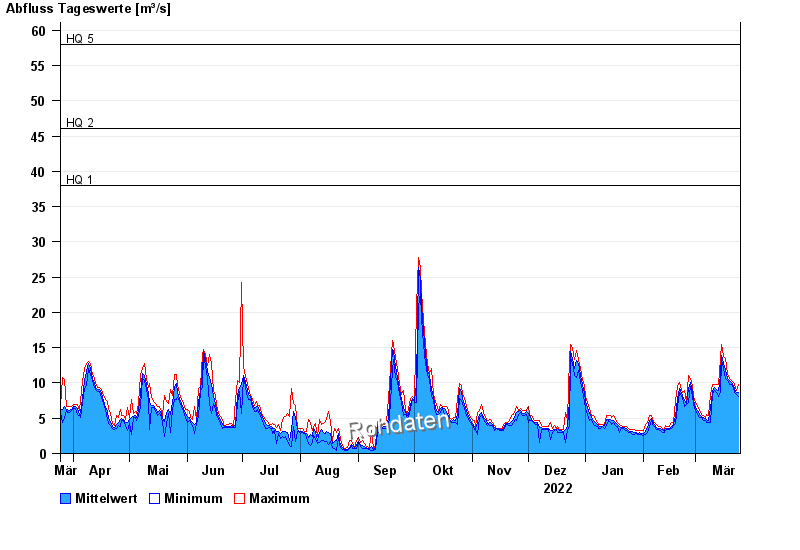
- HQ1 38 m³/s
- HQ2 46 m³/s
- HQ5 58 m³/s
- HQ10 70 m³/s
- HQ20 84 m³/s
- HQ50 100 m³/s
- HQ100 120 m³/s
| Date | Mean value [m³/s] | Maximum [m³/s] | Minimum [m³/s] |
|---|---|---|---|
| 24.03.2023 | 8.59 | 9.78 | 8.01 |
| 23.03.2023 | 8.61 | 8.89 | 8.3 |
| 22.03.2023 | 9.05 | 9.78 | 8.59 |
| 21.03.2023 | 9.61 | 10.1 | 9.18 |
| 20.03.2023 | 10.1 | 10.4 | 9.78 |
| 19.03.2023 | 10.4 | 10.7 | 9.85 |
| 18.03.2023 | 10.7 | 11.4 | 10.4 |
© Bayerisches Landesamt für Umwelt 2024