

Chart of year Schmerold / Mangfall
Discharge from 01.01.2024 to 26.04.2024
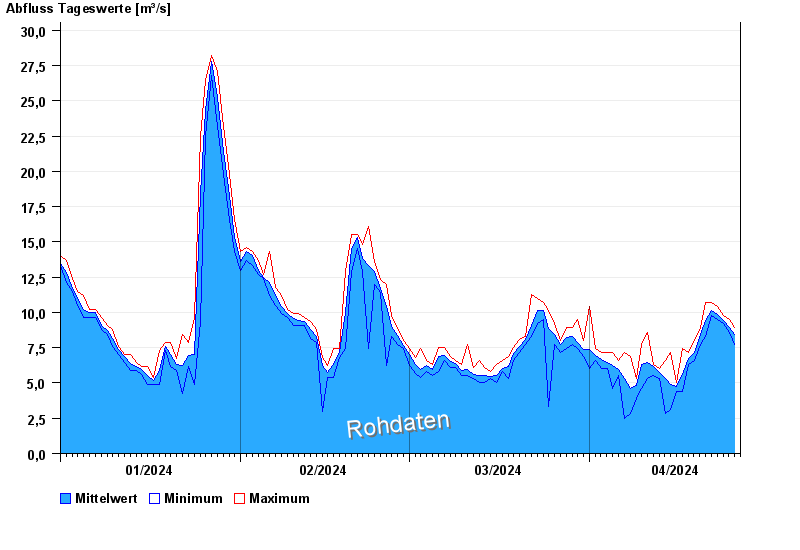
| Date | Mean value [m³/s] | Maximum [m³/s] | Minimum [m³/s] |
|---|---|---|---|
| 26.04.2024 | 8.47 | 8.91 | 7.73 |
| 25.04.2024 | 8.95 | 9.5 | 8.61 |
| 24.04.2024 | 9.45 | 9.8 | 9.2 |
| 23.04.2024 | 9.88 | 10.4 | 9.5 |
| 22.04.2024 | 10.1 | 10.7 | 9.8 |
| 21.04.2024 | 9.45 | 10.7 | 8.32 |
| 20.04.2024 | 8.41 | 8.91 | 7.73 |
© Bayerisches Landesamt für Umwelt 2024