

Chart of year Schmerold / Mangfall
Discharge from 07.06.2022 to 06.06.2023
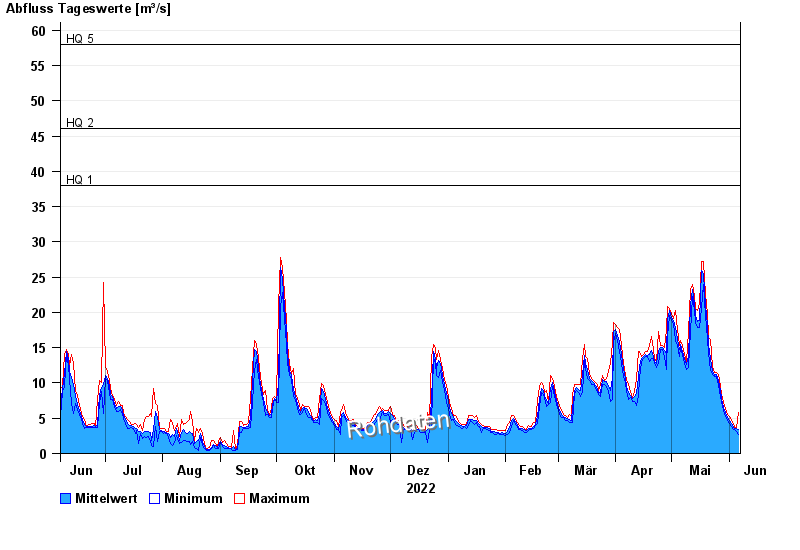
- HQ1 38 m³/s
- HQ2 46 m³/s
- HQ5 58 m³/s
- HQ10 70 m³/s
- HQ20 84 m³/s
- HQ50 100 m³/s
- HQ100 120 m³/s
| Date | Mean value [m³/s] | Maximum [m³/s] | Minimum [m³/s] |
|---|---|---|---|
| 06.06.2023 | 3.47 | 5.8 | 2.73 |
| 05.06.2023 | 3.5 | 3.63 | 3.06 |
| 04.06.2023 | 3.46 | 3.63 | 3.43 |
| 03.06.2023 | 3.79 | 4.26 | 3.43 |
| 02.06.2023 | 4.29 | 4.74 | 3.83 |
| 01.06.2023 | 4.73 | 5.26 | 4.26 |
| 31.05.2023 | 5.13 | 5.53 | 4.74 |
© Bayerisches Landesamt für Umwelt 2024