
- Start >
- Rivers >
- Discharge >
- Bayern >
- Schlehenmühle >
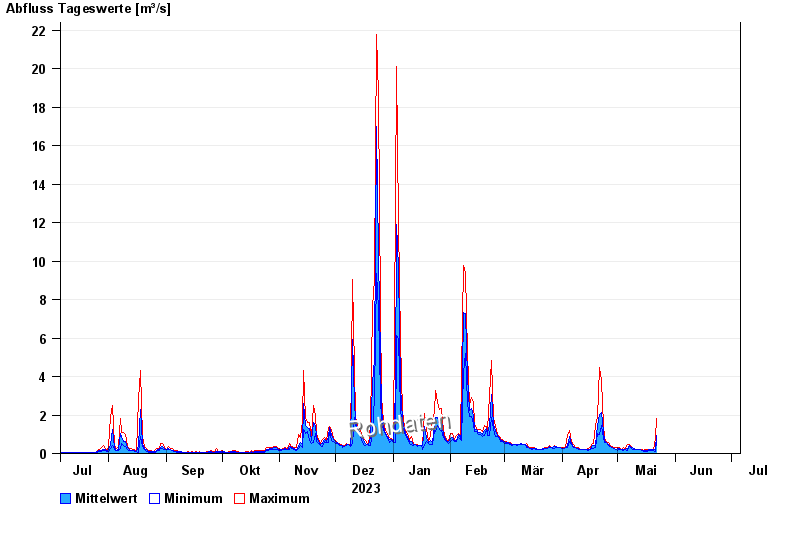
- Chart of year

Chart of year Schlehenmühle / Roter Main
Discharge from 06.07.2023 to 05.07.2024
| Date | Mean value [m³/s] | Maximum [m³/s] | Minimum [m³/s] |
|---|---|---|---|
| 19.06.2024 | 0.144 | 0.15 | 0.127 |
| 18.06.2024 | 0.138 | 0.176 | 0.105 |
| 17.06.2024 | 0.154 | 0.203 | 0.127 |
| 16.06.2024 | 0.177 | 0.232 | 0.127 |
| 15.06.2024 | 0.177 | 0.263 | 0.127 |
| 14.06.2024 | 0.164 | 0.232 | 0.127 |
| 13.06.2024 | 0.159 | 0.203 | 0.127 |
© Bayerisches Landesamt für Umwelt 2024