
- Start >
- Rivers >
- Discharge >
- Bayern >
- Schlehenmühle >
- Chart of year

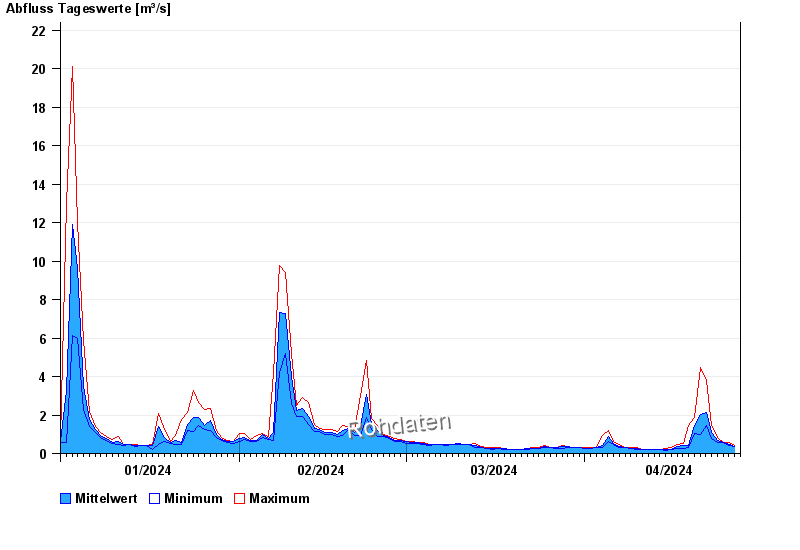
Chart of year Schlehenmühle / Roter Main
Discharge from 01.01.2024 to 27.04.2024
| Date | Mean value [m³/s] | Maximum [m³/s] | Minimum [m³/s] |
|---|---|---|---|
| 27.04.2024 | 0.413 | 0.413 | 0.413 |
| 26.04.2024 | 0.477 | 0.549 | 0.413 |
| 25.04.2024 | 0.555 | 0.596 | 0.549 |
| 24.04.2024 | 0.69 | 0.848 | 0.596 |
| 23.04.2024 | 1.08 | 1.45 | 0.797 |
| 22.04.2024 | 2.11 | 3.81 | 1.45 |
| 21.04.2024 | 2.05 | 4.49 | 1 |
© Bayerisches Landesamt für Umwelt 2024