
- Start >
- Rivers >
- Discharge >
- Bayern >
- Scheinfeld >
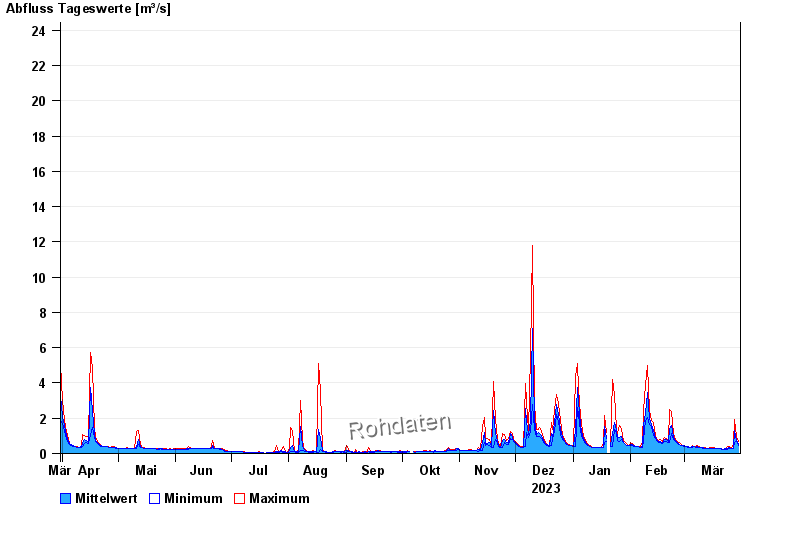
- Chart of year

Chart of year Scheinfeld / Scheine
Discharge from 31.03.2023 to 30.03.2024
 Für diesen Pegel sind keine Jährlichkeiten hinterlegt.
| Date | Mean value [m³/s] | Maximum [m³/s] | Minimum [m³/s] |
|---|---|---|---|
| 30.03.2024 | 0.568 | 0.701 | 0.464 |
| 29.03.2024 | 0.763 | 0.973 | 0.701 |
| 28.03.2024 | 1.32 | 1.94 | 0.607 |
| 27.03.2024 | 0.281 | 0.548 | 0.272 |
| 26.03.2024 | 0.275 | 0.293 | 0.272 |
| 25.03.2024 | 0.314 | 0.386 | 0.272 |
| 24.03.2024 | 0.278 | 0.386 | 0.252 |
© Bayerisches Landesamt für Umwelt 2024