
- Start >
- Rivers >
- Discharge >
- Bayern >
- Scheinfeld >
- Chart of year

Chart of year Scheinfeld / Scheine
Discharge from 01.01.2023 to 31.12.2023
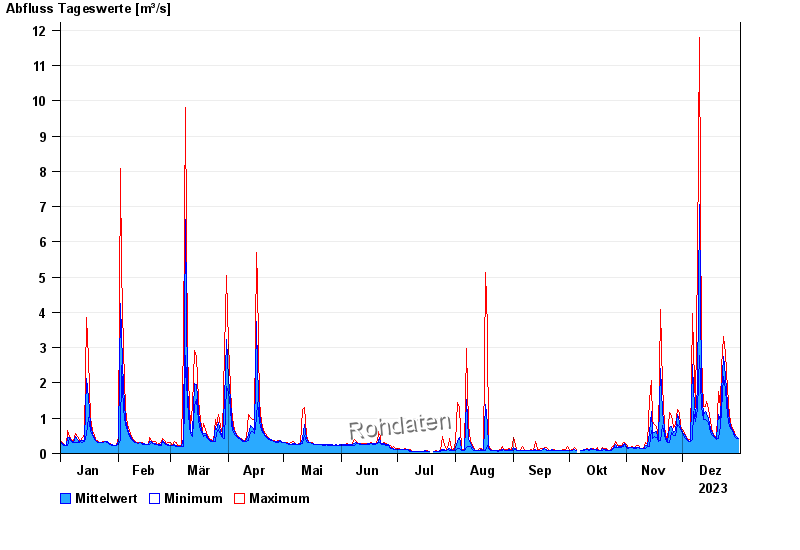
| Date | Mean value [m³/s] | Maximum [m³/s] | Minimum [m³/s] |
|---|---|---|---|
| 31.12.2023 | 0.437 | 0.437 | 0.437 |
| 30.12.2023 | 0.473 | 0.491 | 0.437 |
| 29.12.2023 | 0.535 | 0.577 | 0.491 |
| 28.12.2023 | 0.603 | 0.669 | 0.577 |
| 27.12.2023 | 0.695 | 0.766 | 0.669 |
| 26.12.2023 | 0.895 | 1.08 | 0.766 |
| 25.12.2023 | 1.38 | 1.85 | 1.08 |
© Bayerisches Landesamt für Umwelt 2024