

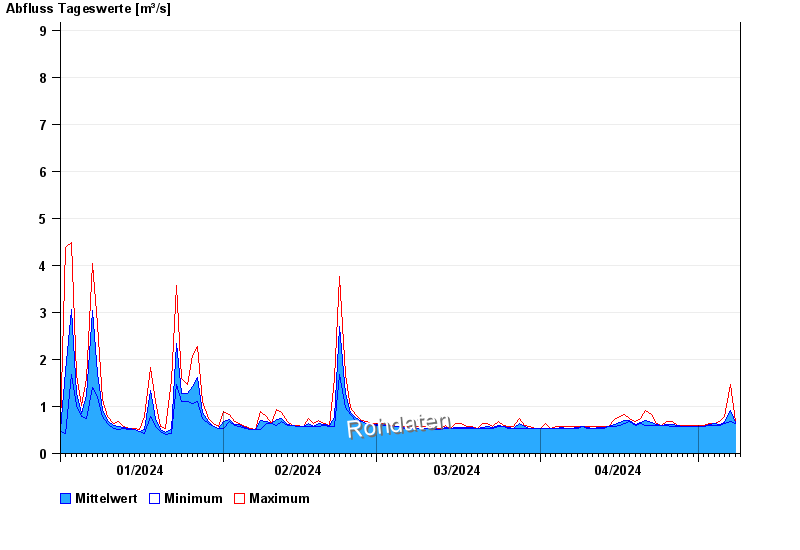
Chart of year Salching / Aiterach
Discharge from 01.01.2024 to 08.05.2024
- HQ1 10 m³/s
- HQ2 16 m³/s
- HQ5 23 m³/s
- HQ10 28 m³/s
- HQ20 33 m³/s
- HQ50 40 m³/s
- HQ100 45 m³/s
| Date | Mean value [m³/s] | Maximum [m³/s] | Minimum [m³/s] |
|---|---|---|---|
| 08.05.2024 | 0.66 | 0.675 | 0.638 |
| 07.05.2024 | 0.915 | 1.46 | 0.675 |
| 06.05.2024 | 0.649 | 0.79 | 0.638 |
| 05.05.2024 | 0.624 | 0.675 | 0.602 |
| 04.05.2024 | 0.629 | 0.638 | 0.602 |
| 03.05.2024 | 0.609 | 0.638 | 0.602 |
| 02.05.2024 | 0.578 | 0.602 | 0.566 |
© Bayerisches Landesamt für Umwelt 2024