
- Start >
- Rivers >
- Discharge >
- Bayern >
- Sachsenheim >
- Chart of year

Chart of year Sachsenheim / Wern
Discharge from 01.01.2024 to 01.05.2024
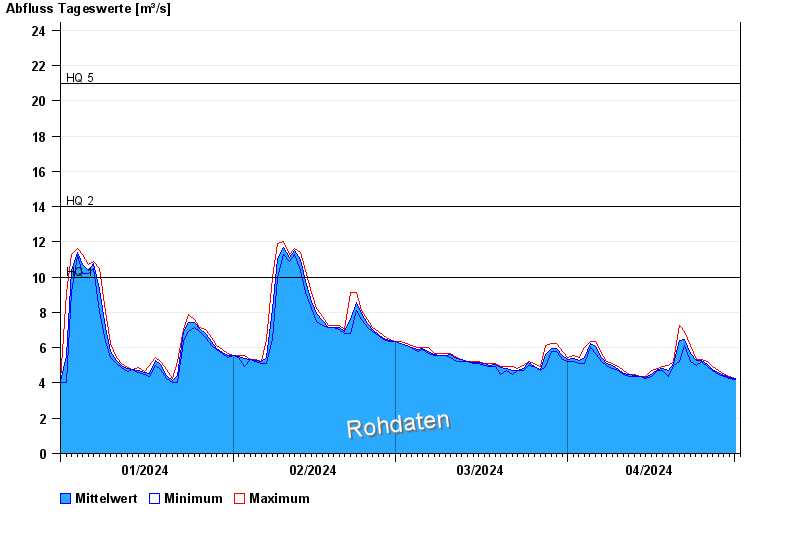
- HQ1 10 m³/s
- HQ2 14 m³/s
- HQ5 21 m³/s
- HQ10 27 m³/s
- HQ20 33 m³/s
- HQ50 44 m³/s
- HQ100 53 m³/s
| Date | Mean value [m³/s] | Maximum [m³/s] | Minimum [m³/s] |
|---|---|---|---|
| 01.05.2024 | 4.27 | 4.27 | 4.27 |
| 30.04.2024 | 4.31 | 4.38 | 4.27 |
| 29.04.2024 | 4.42 | 4.48 | 4.38 |
| 28.04.2024 | 4.58 | 4.69 | 4.48 |
| 27.04.2024 | 4.79 | 4.91 | 4.69 |
| 26.04.2024 | 5.03 | 5.23 | 4.91 |
| 25.04.2024 | 5.25 | 5.34 | 5.23 |
© Bayerisches Landesamt für Umwelt 2024