

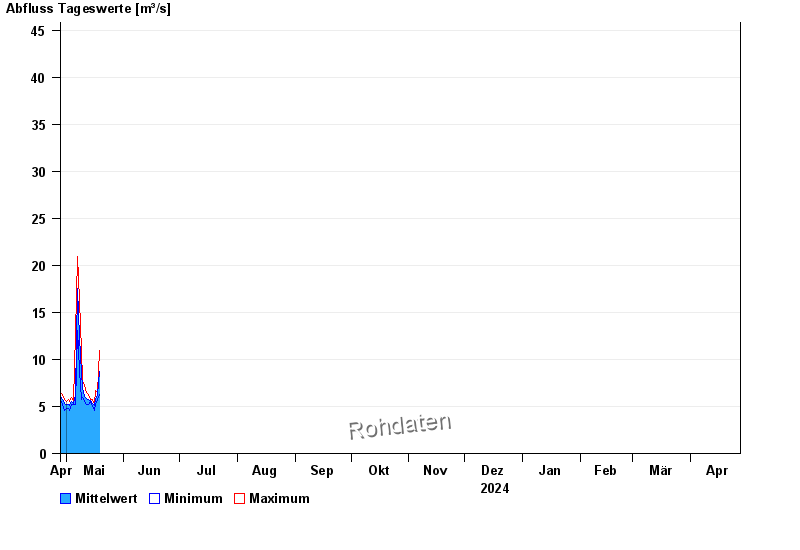
Chart of year Ruhstorf / Rott
Discharge from 28.04.2024 to 27.04.2025
- HQ1 100 m³/s
- HQ2 110 m³/s
- HQ5 160 m³/s
- HQ10 200 m³/s
- HQ20 250 m³/s
- HQ50 337 m³/s
- HQ100 480 m³/s
| Date | Mean value [m³/s] | Maximum [m³/s] | Minimum [m³/s] |
|---|---|---|---|
| 08.05.2024 | 13.6 | 16.3 | 11 |
| 07.05.2024 | 17.5 | 20.9 | 13.1 |
| 06.05.2024 | 6.28 | 12.8 | 5.26 |
| 05.05.2024 | 5.28 | 5.5 | 5.26 |
| 04.05.2024 | 5.49 | 5.98 | 5.26 |
| 03.05.2024 | 5.15 | 5.5 | 4.57 |
| 02.05.2024 | 5.22 | 5.74 | 4.79 |
© Bayerisches Landesamt für Umwelt 2024